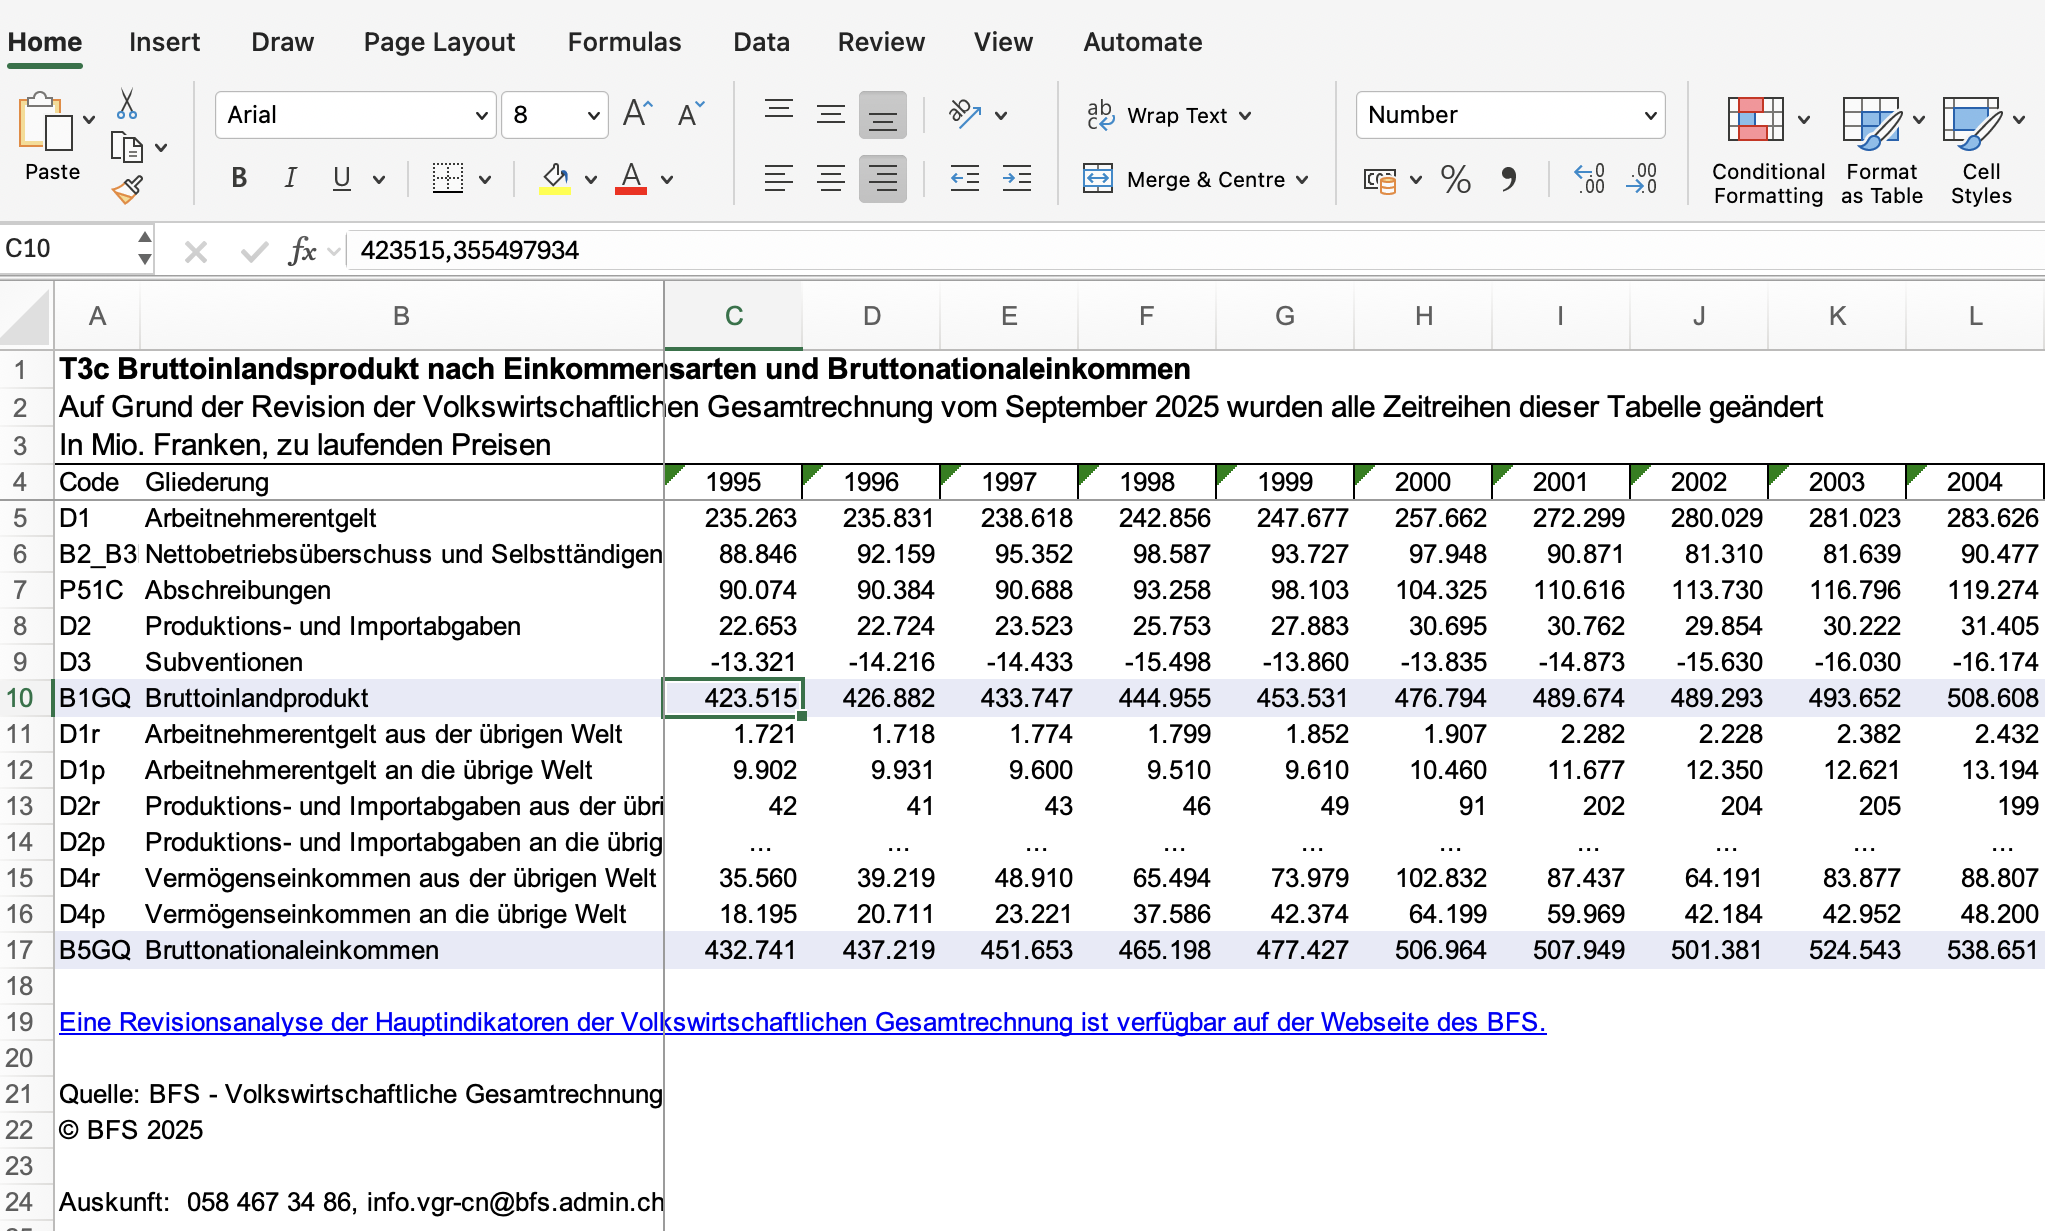
APIs for Economic Data

Guest Lecture 2025

Minna Heim

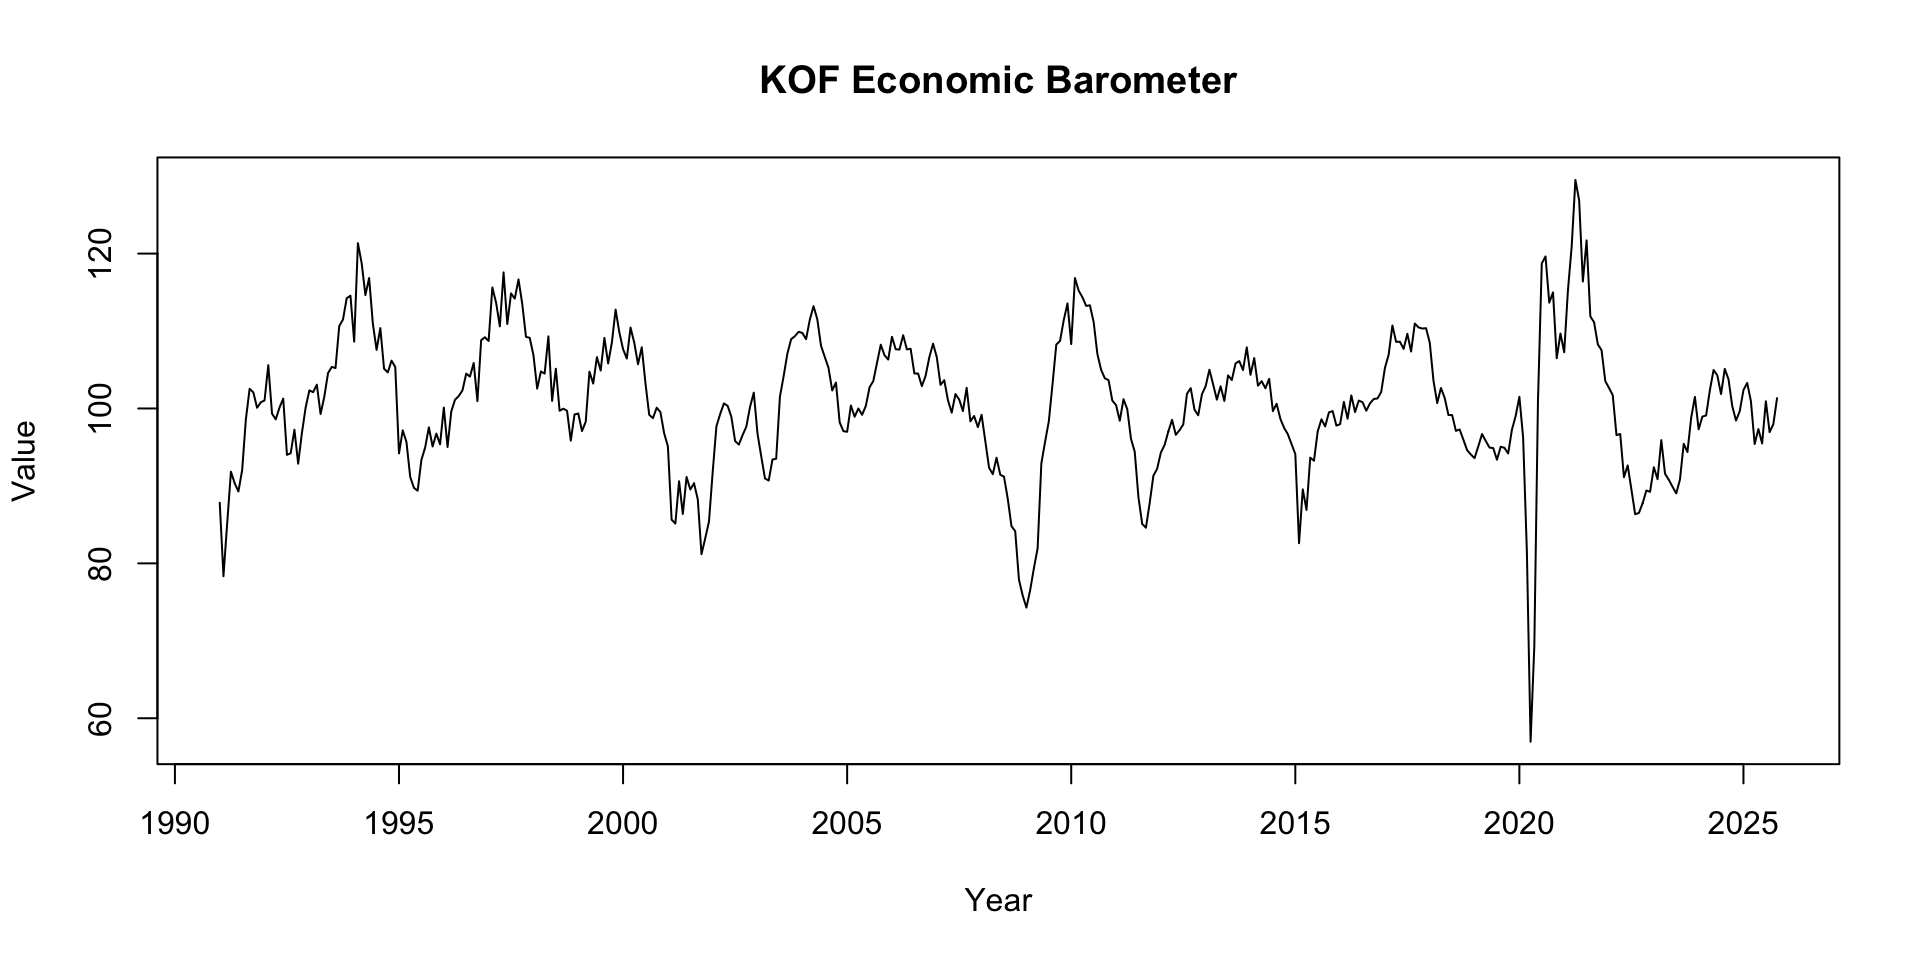
How do we get the data for this Plot?

About me

  • I took this course 4 years ago!
  • Doing a Master in Data Science & minor in Economics at UZH
  • Working at KOF-ETH

About the institute and our work

  • from surveys to innovation to forecasting
  • software, infrastructure and data publications with economic use cases.
  • teaching PhD students to work with data & open source ecosystem.
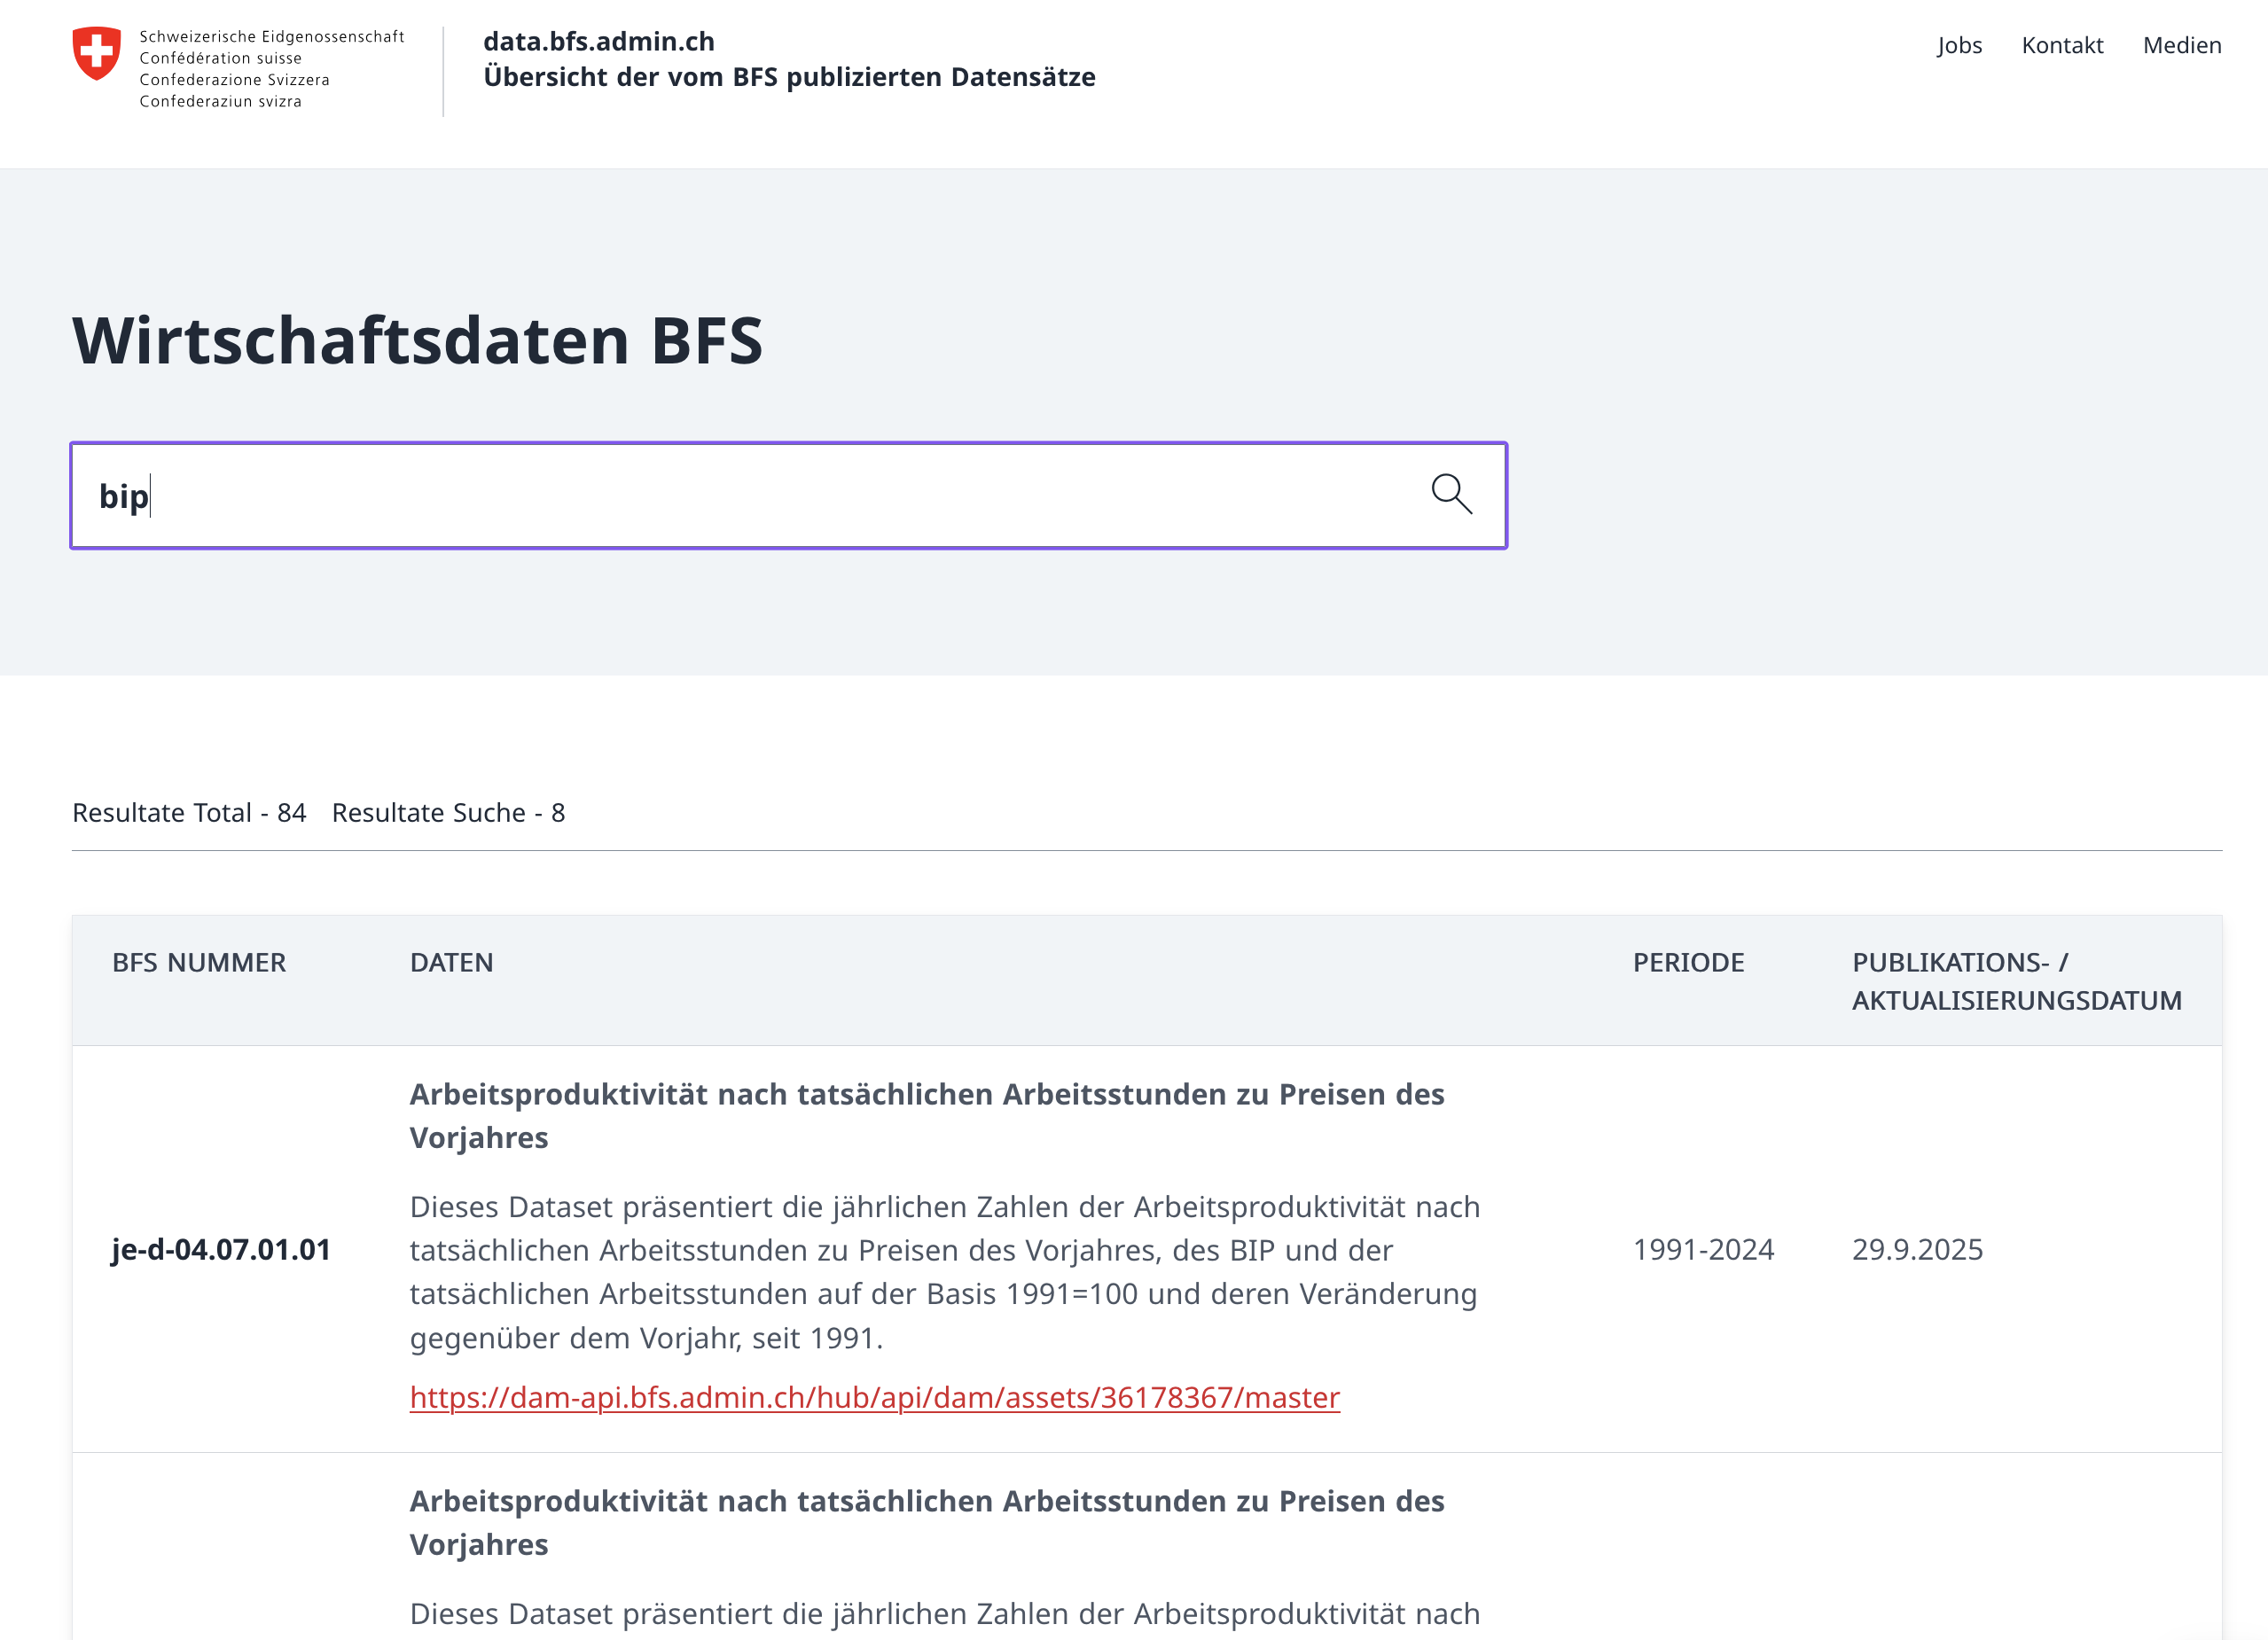
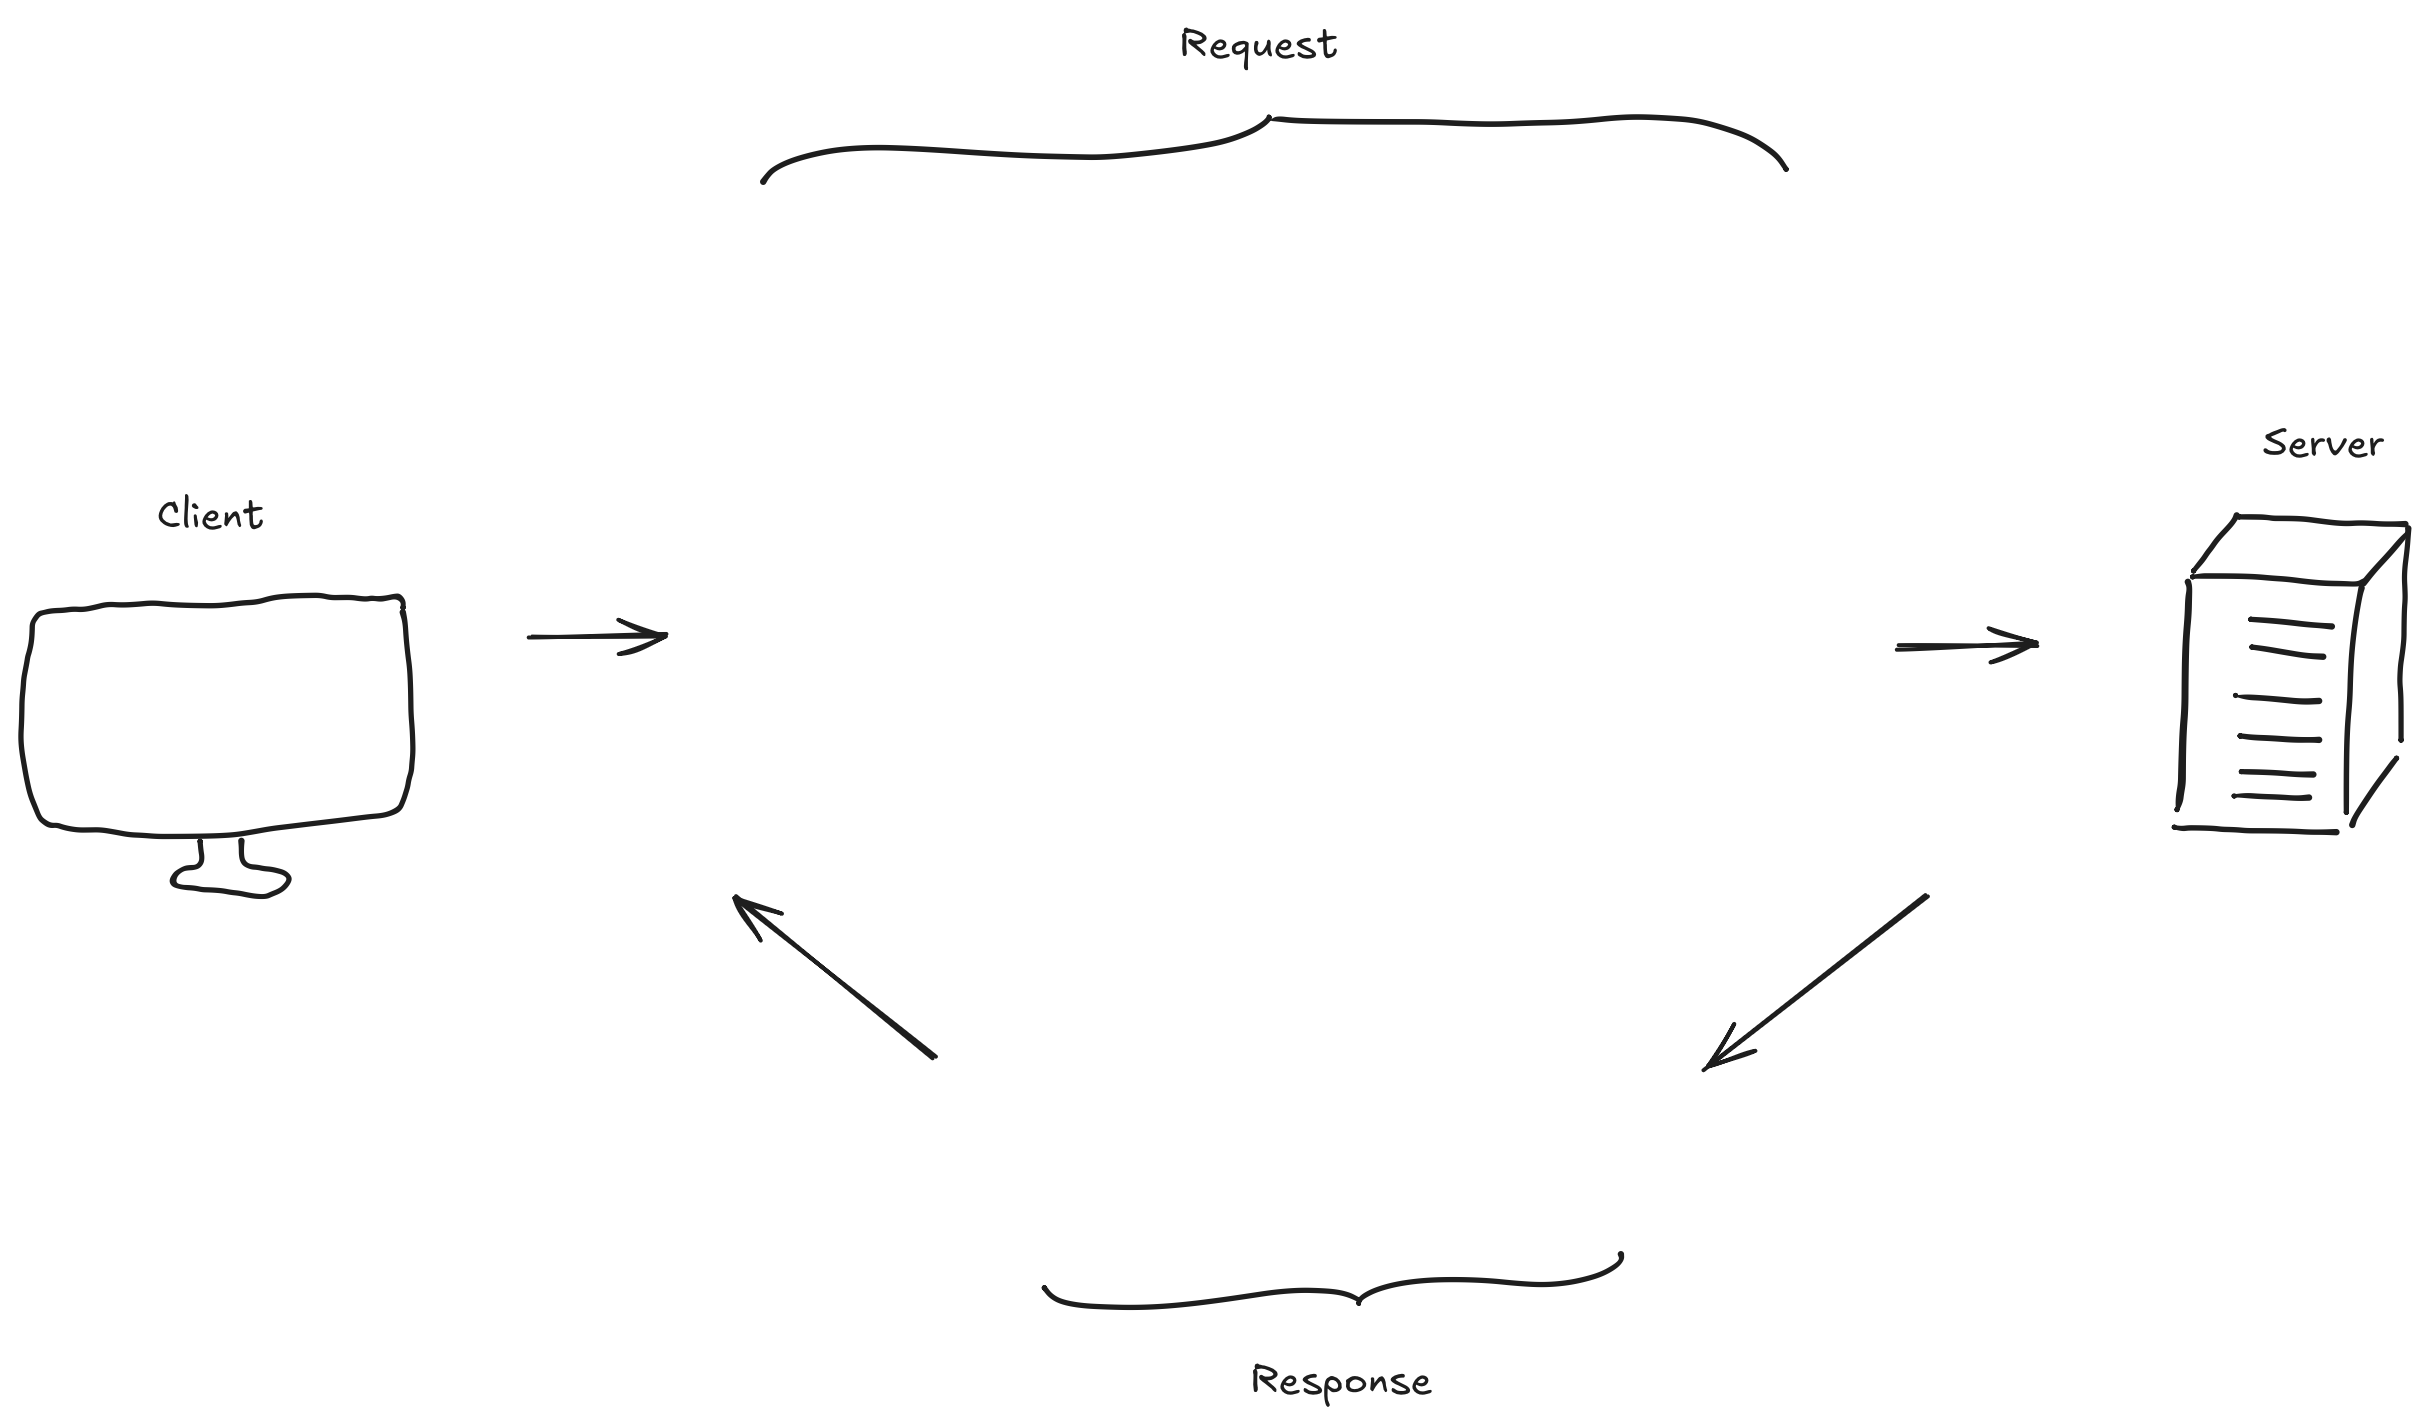
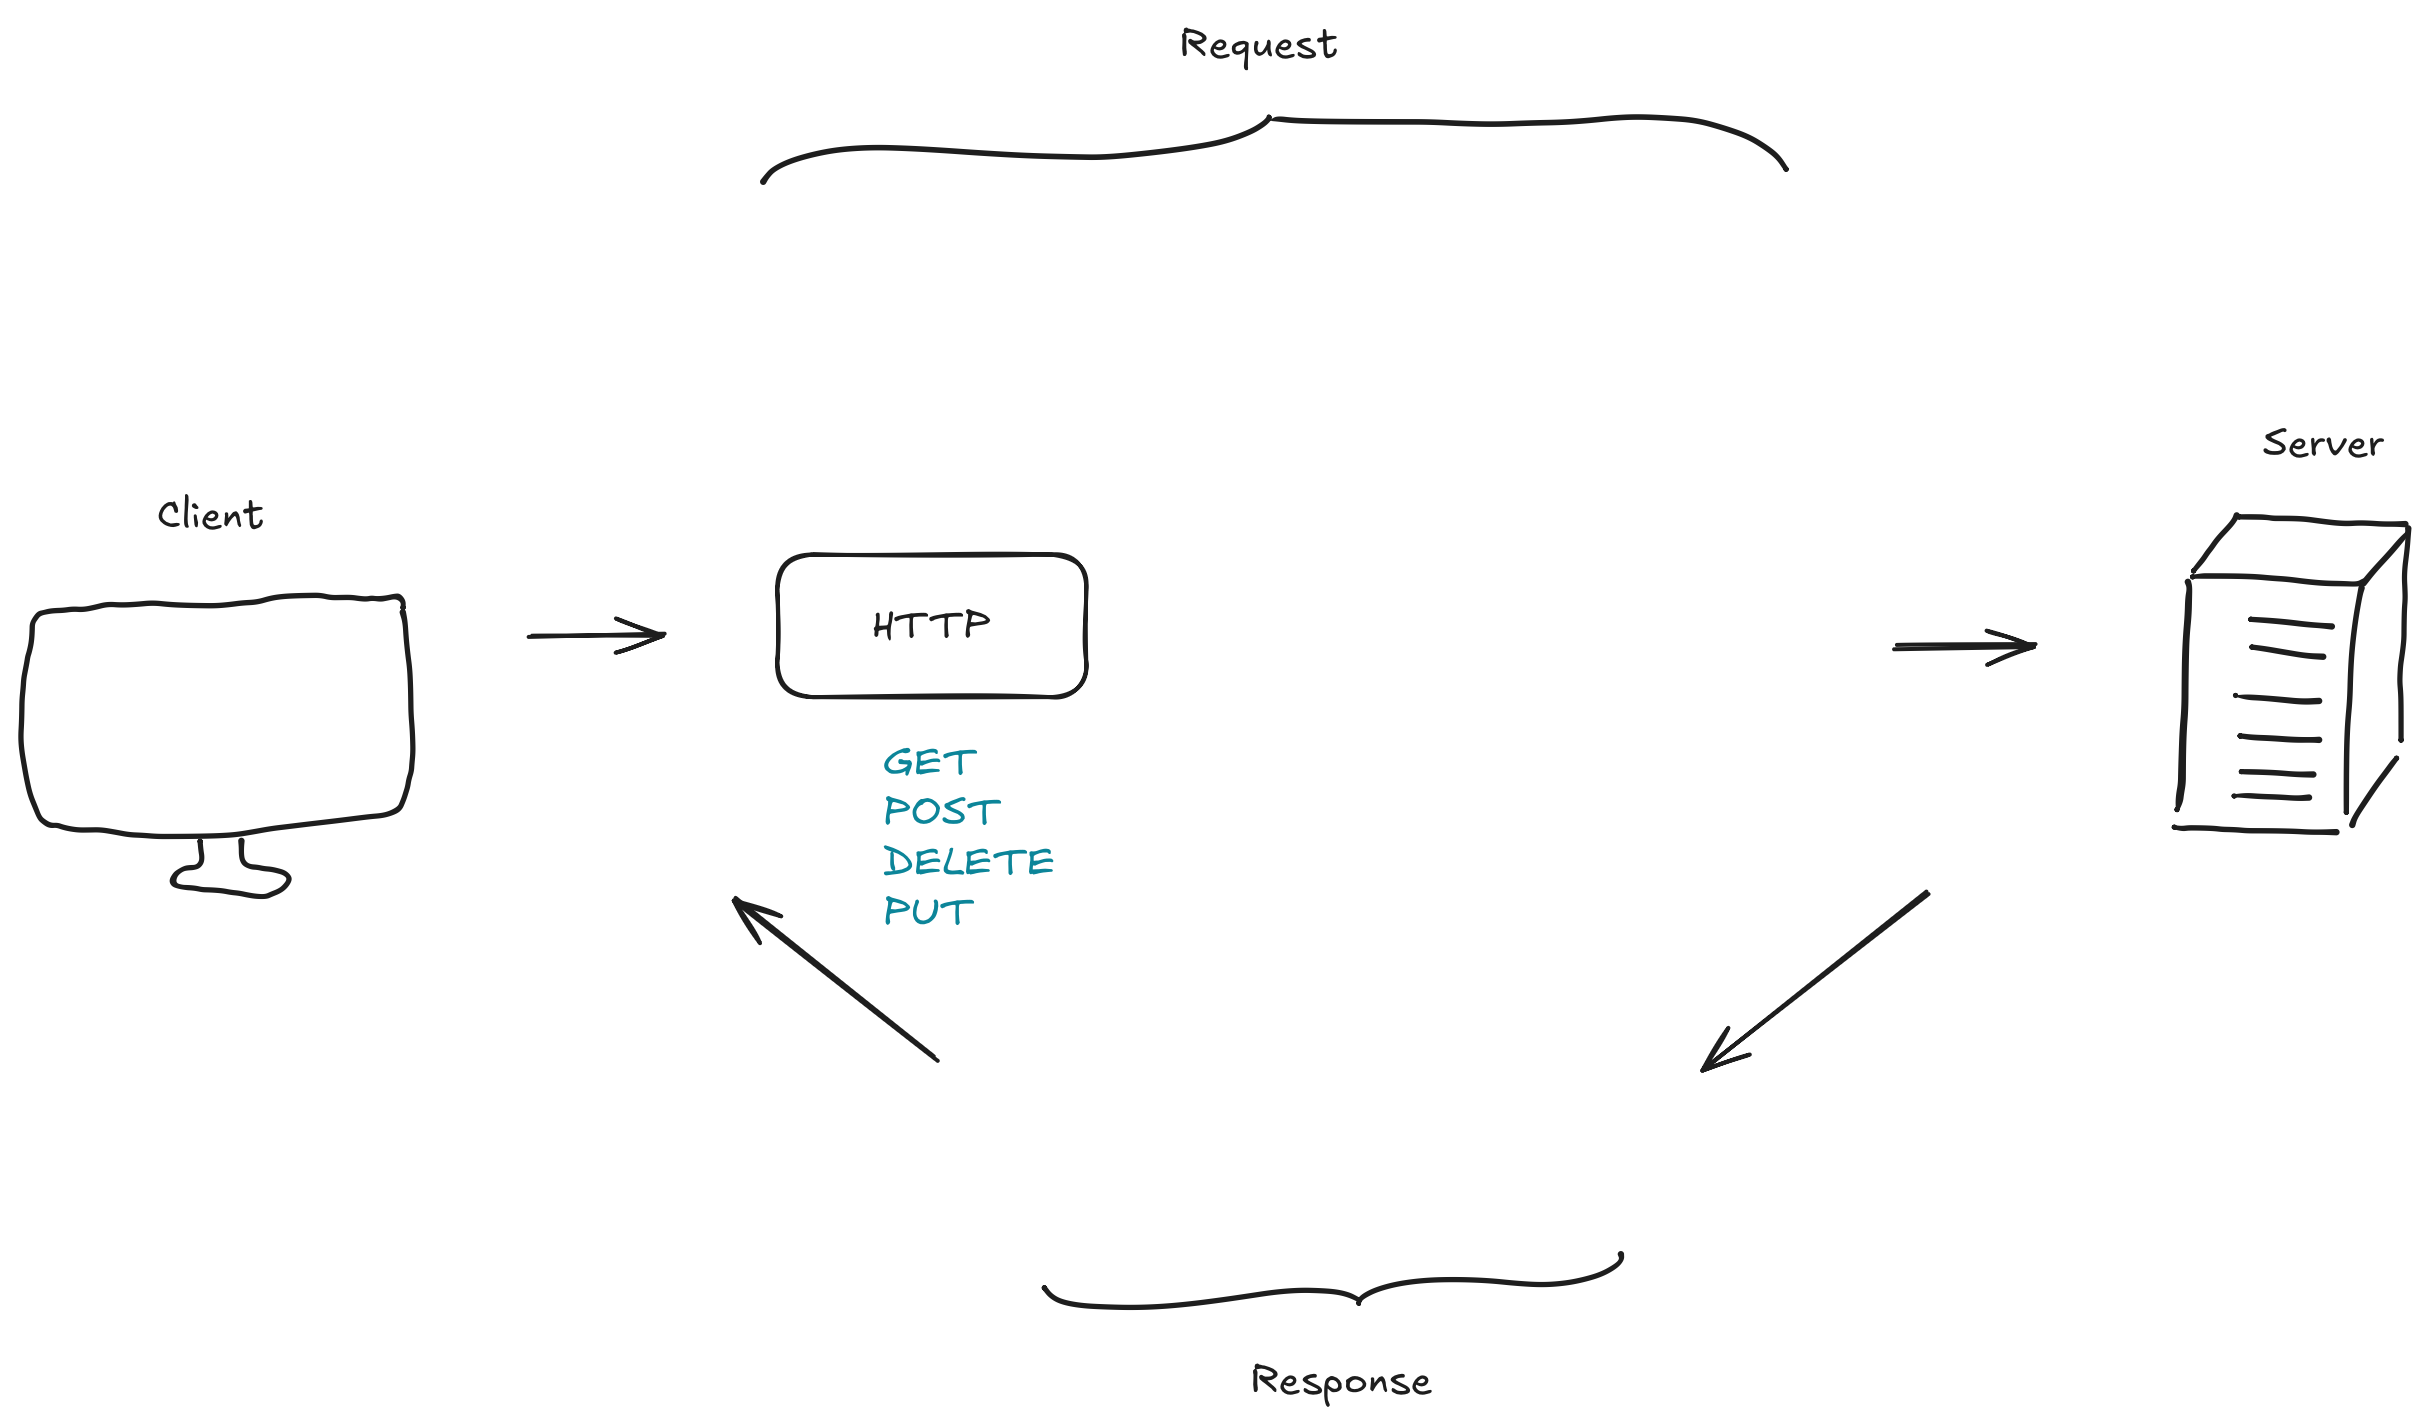
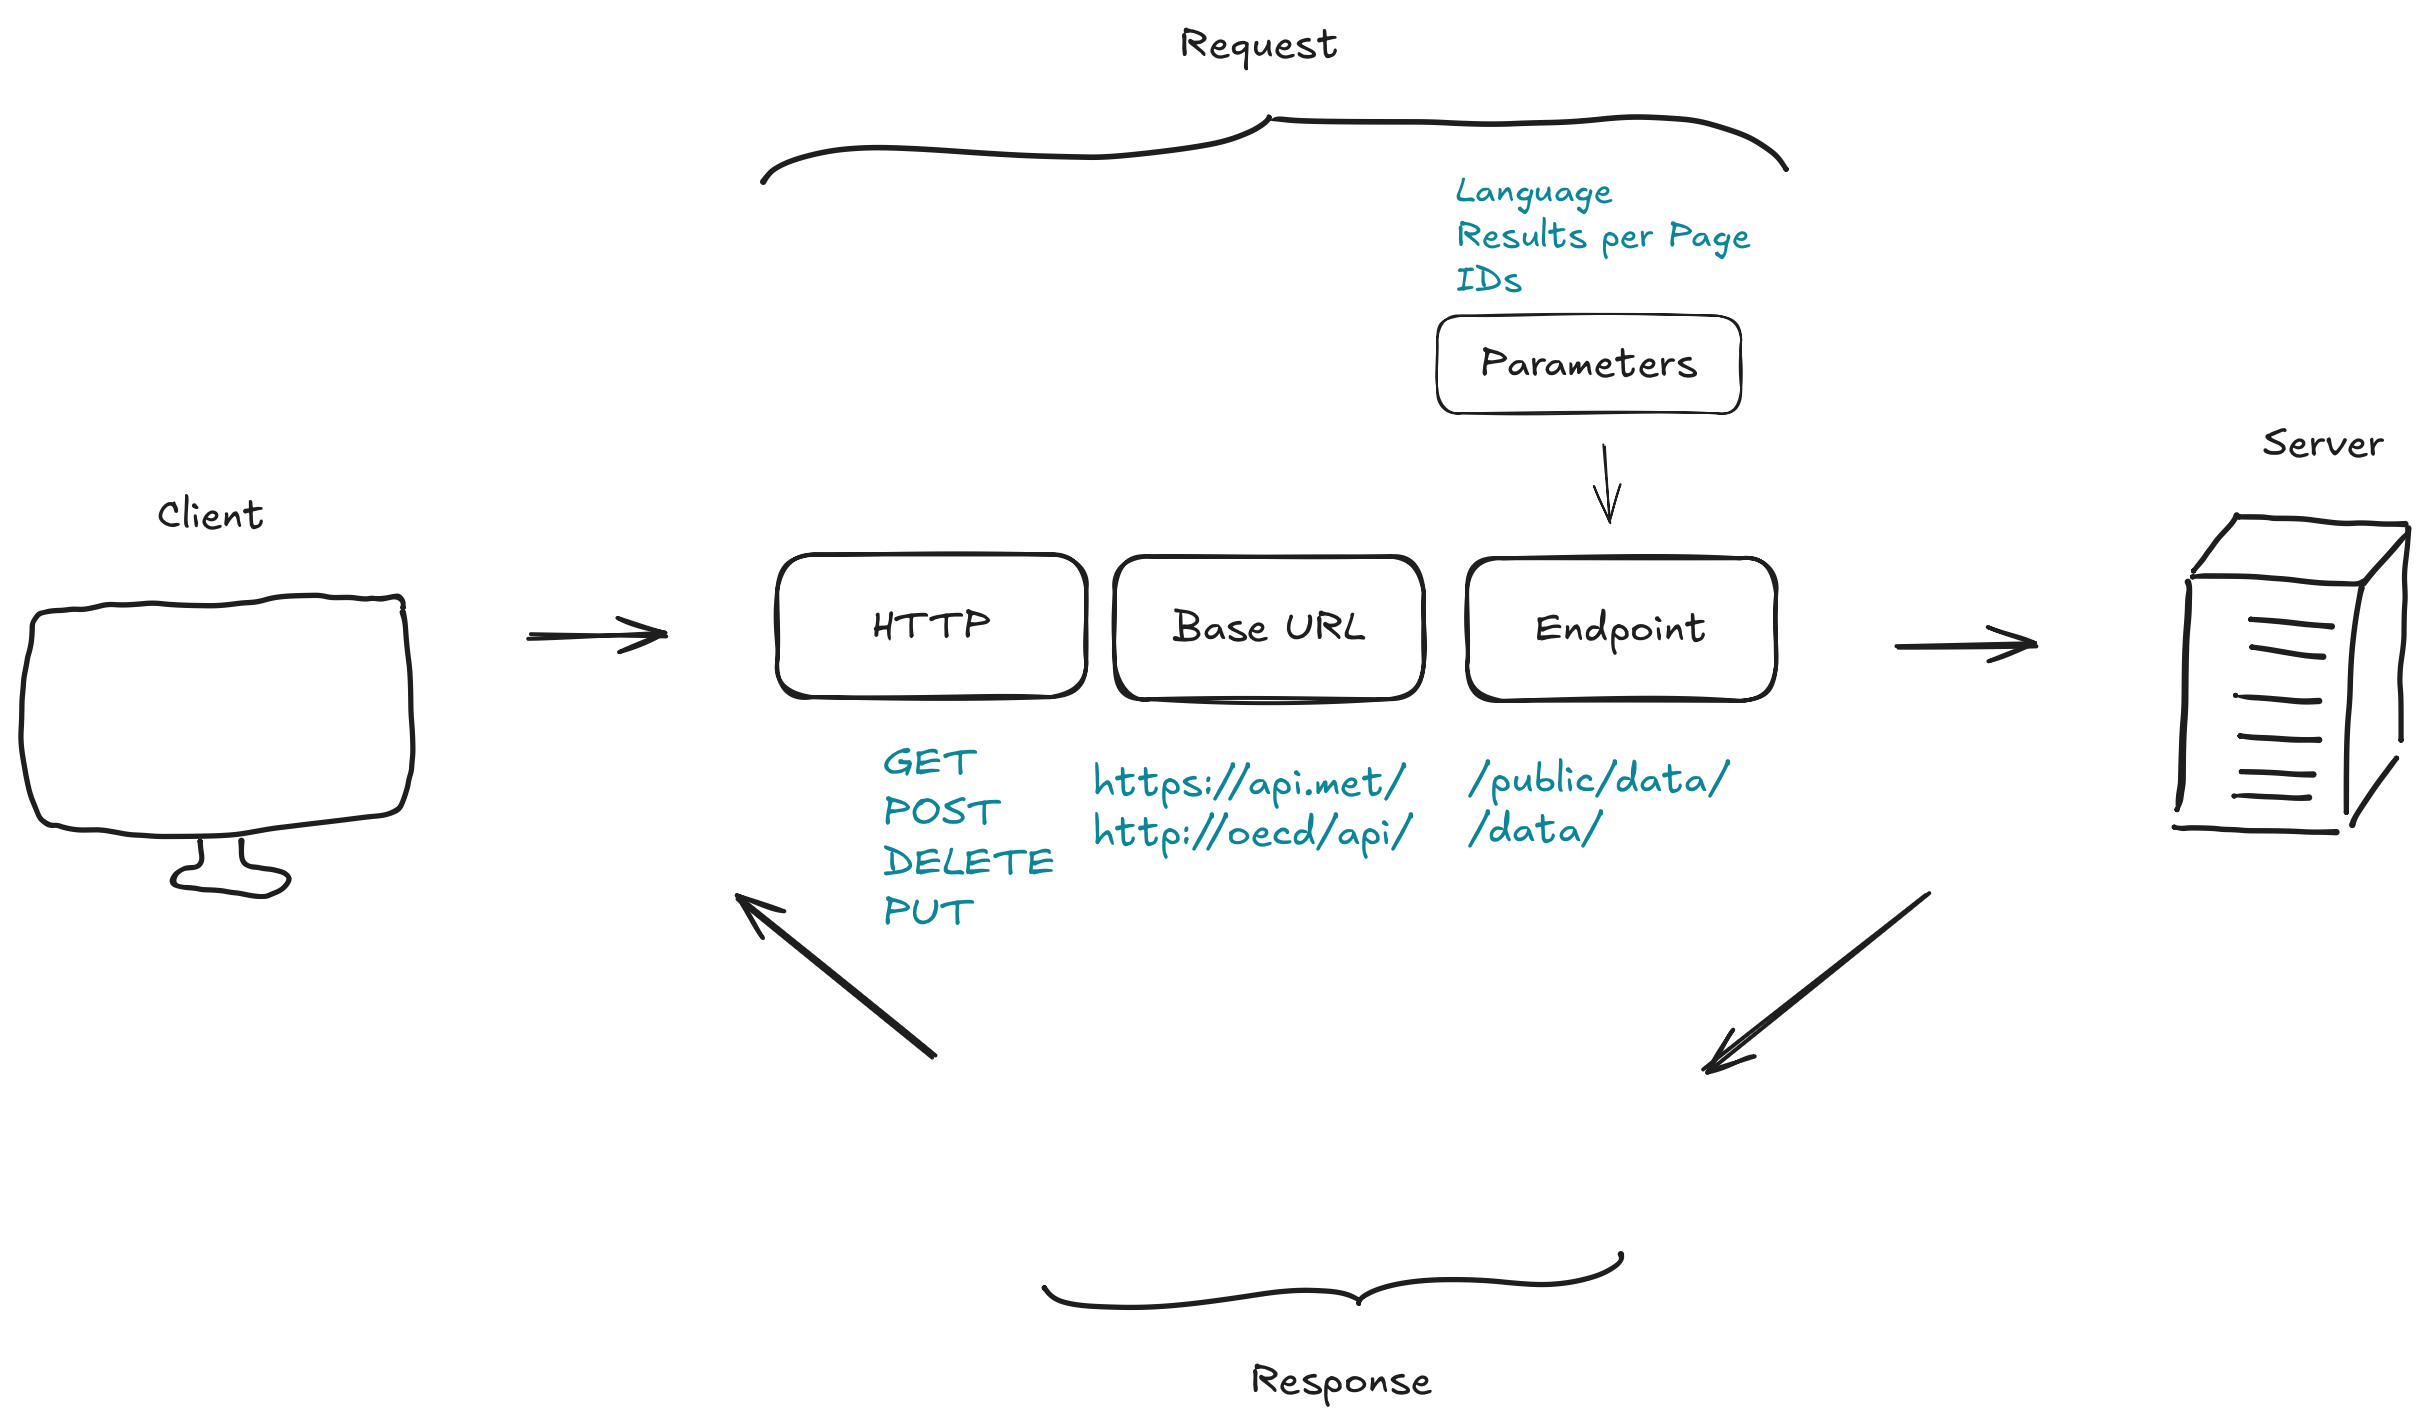
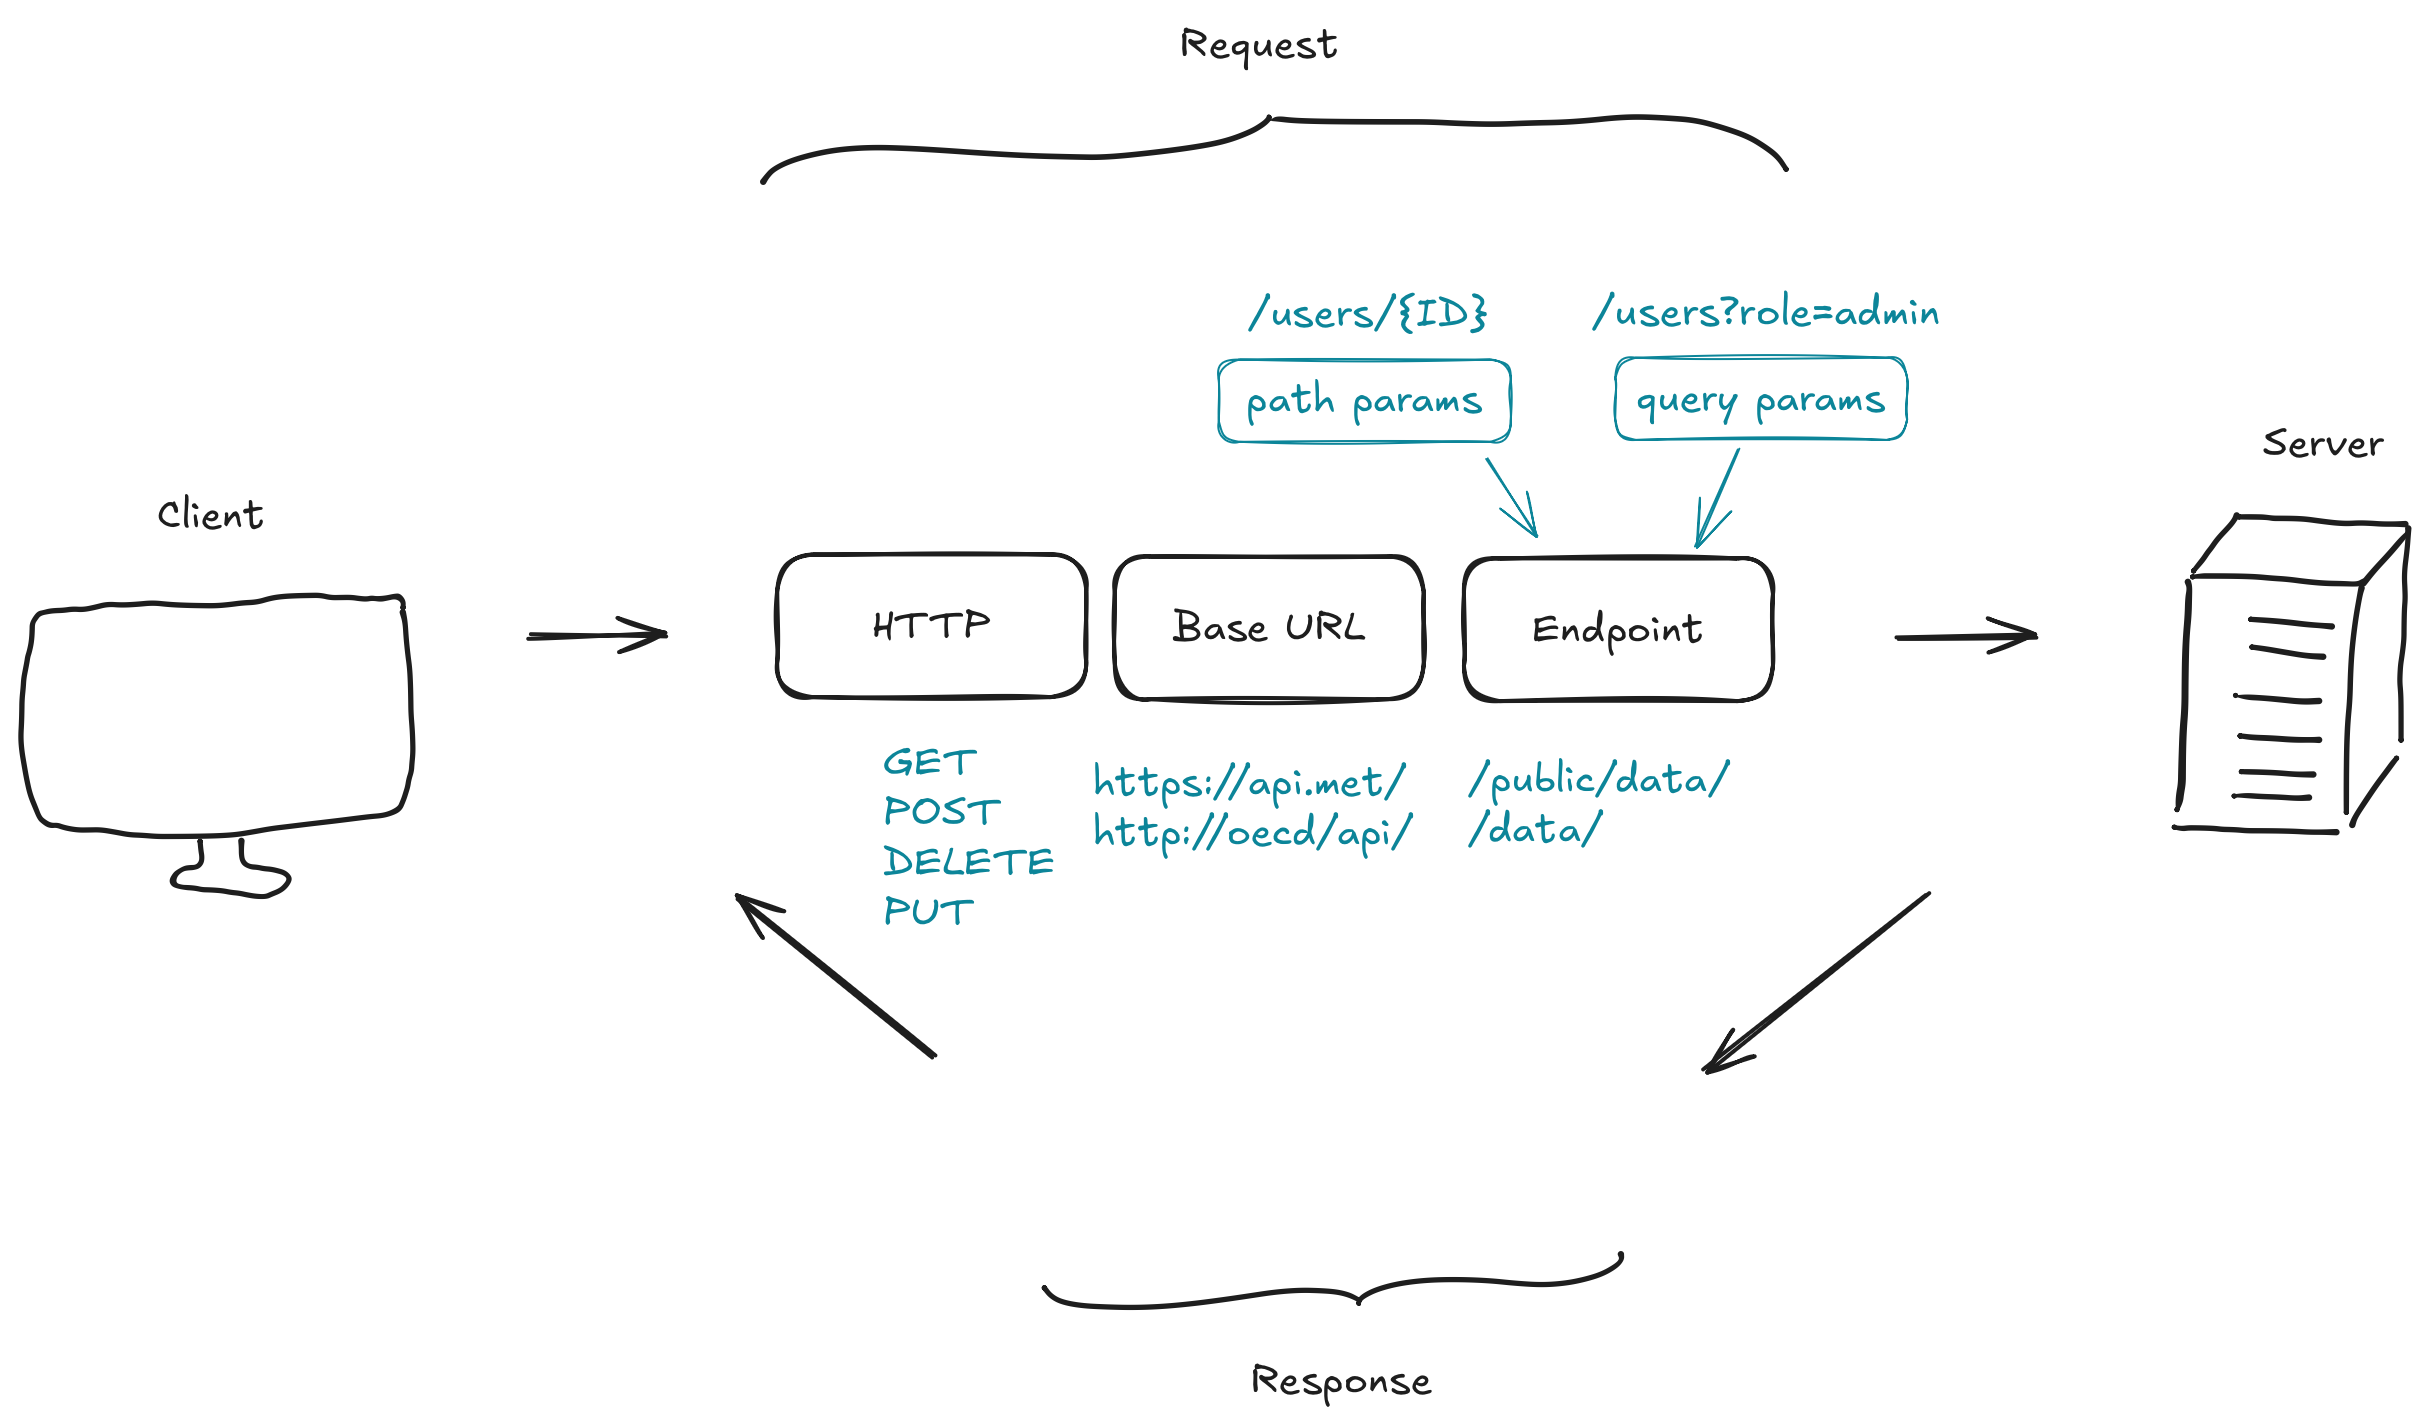
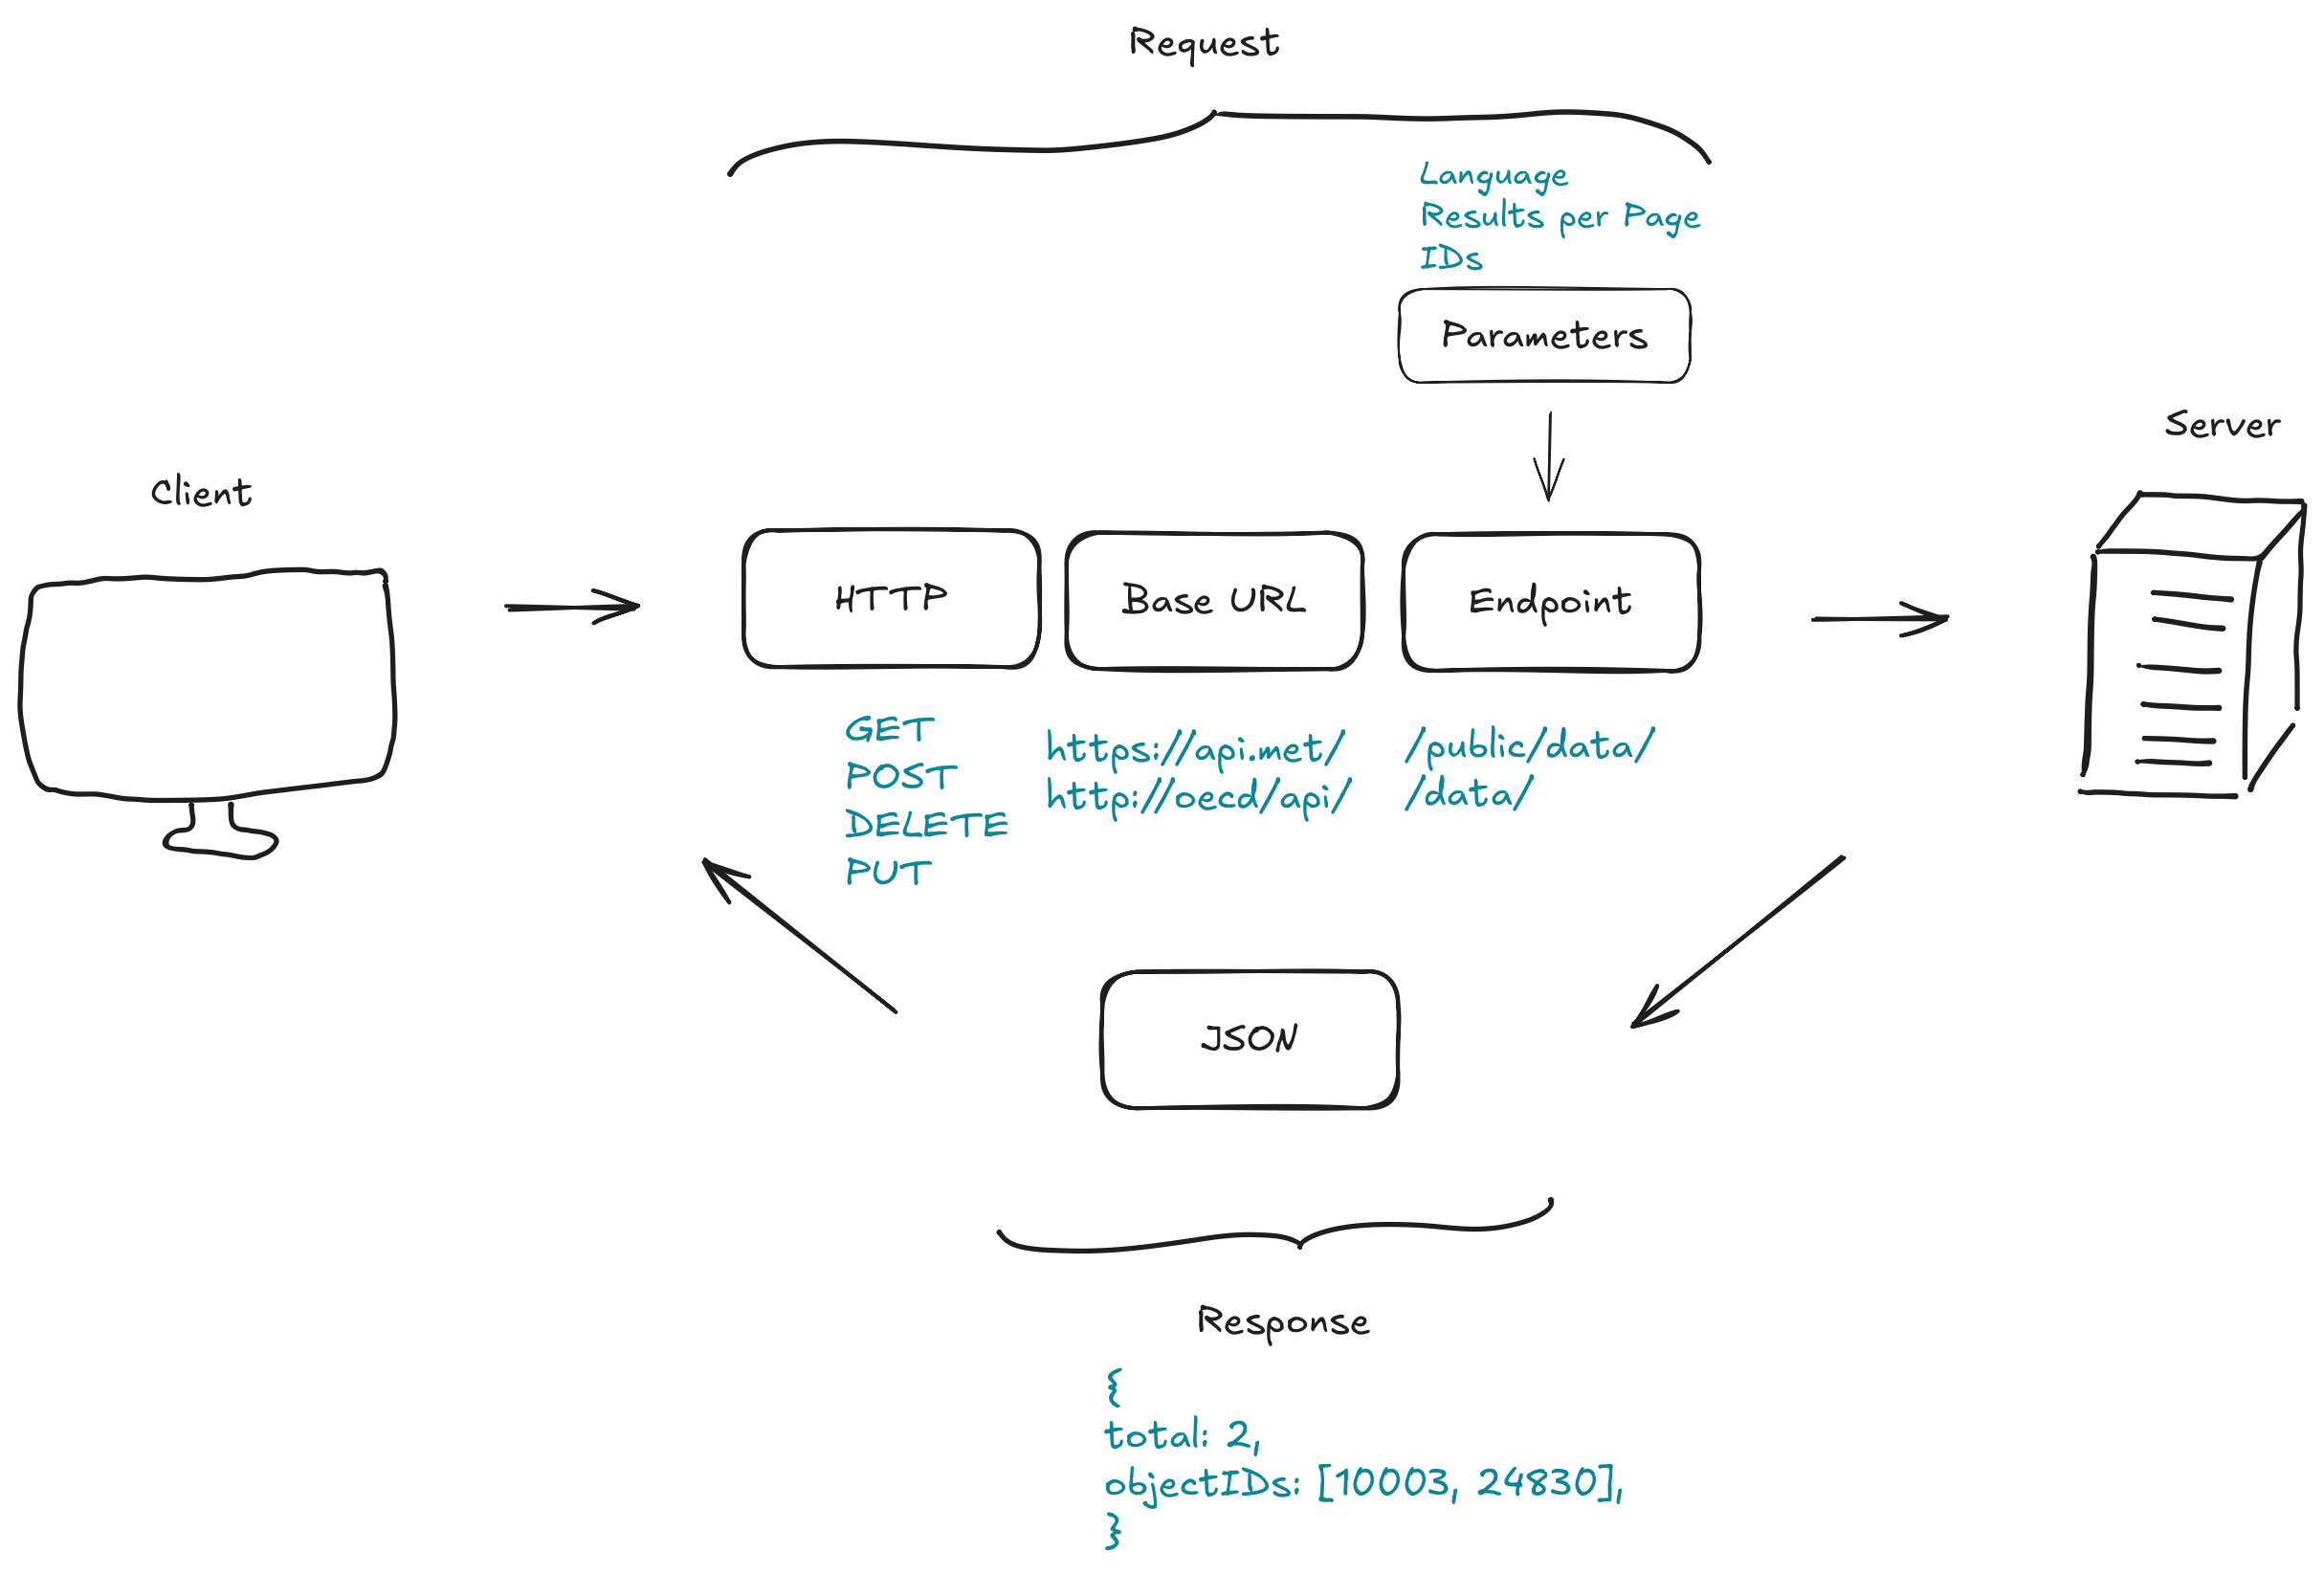
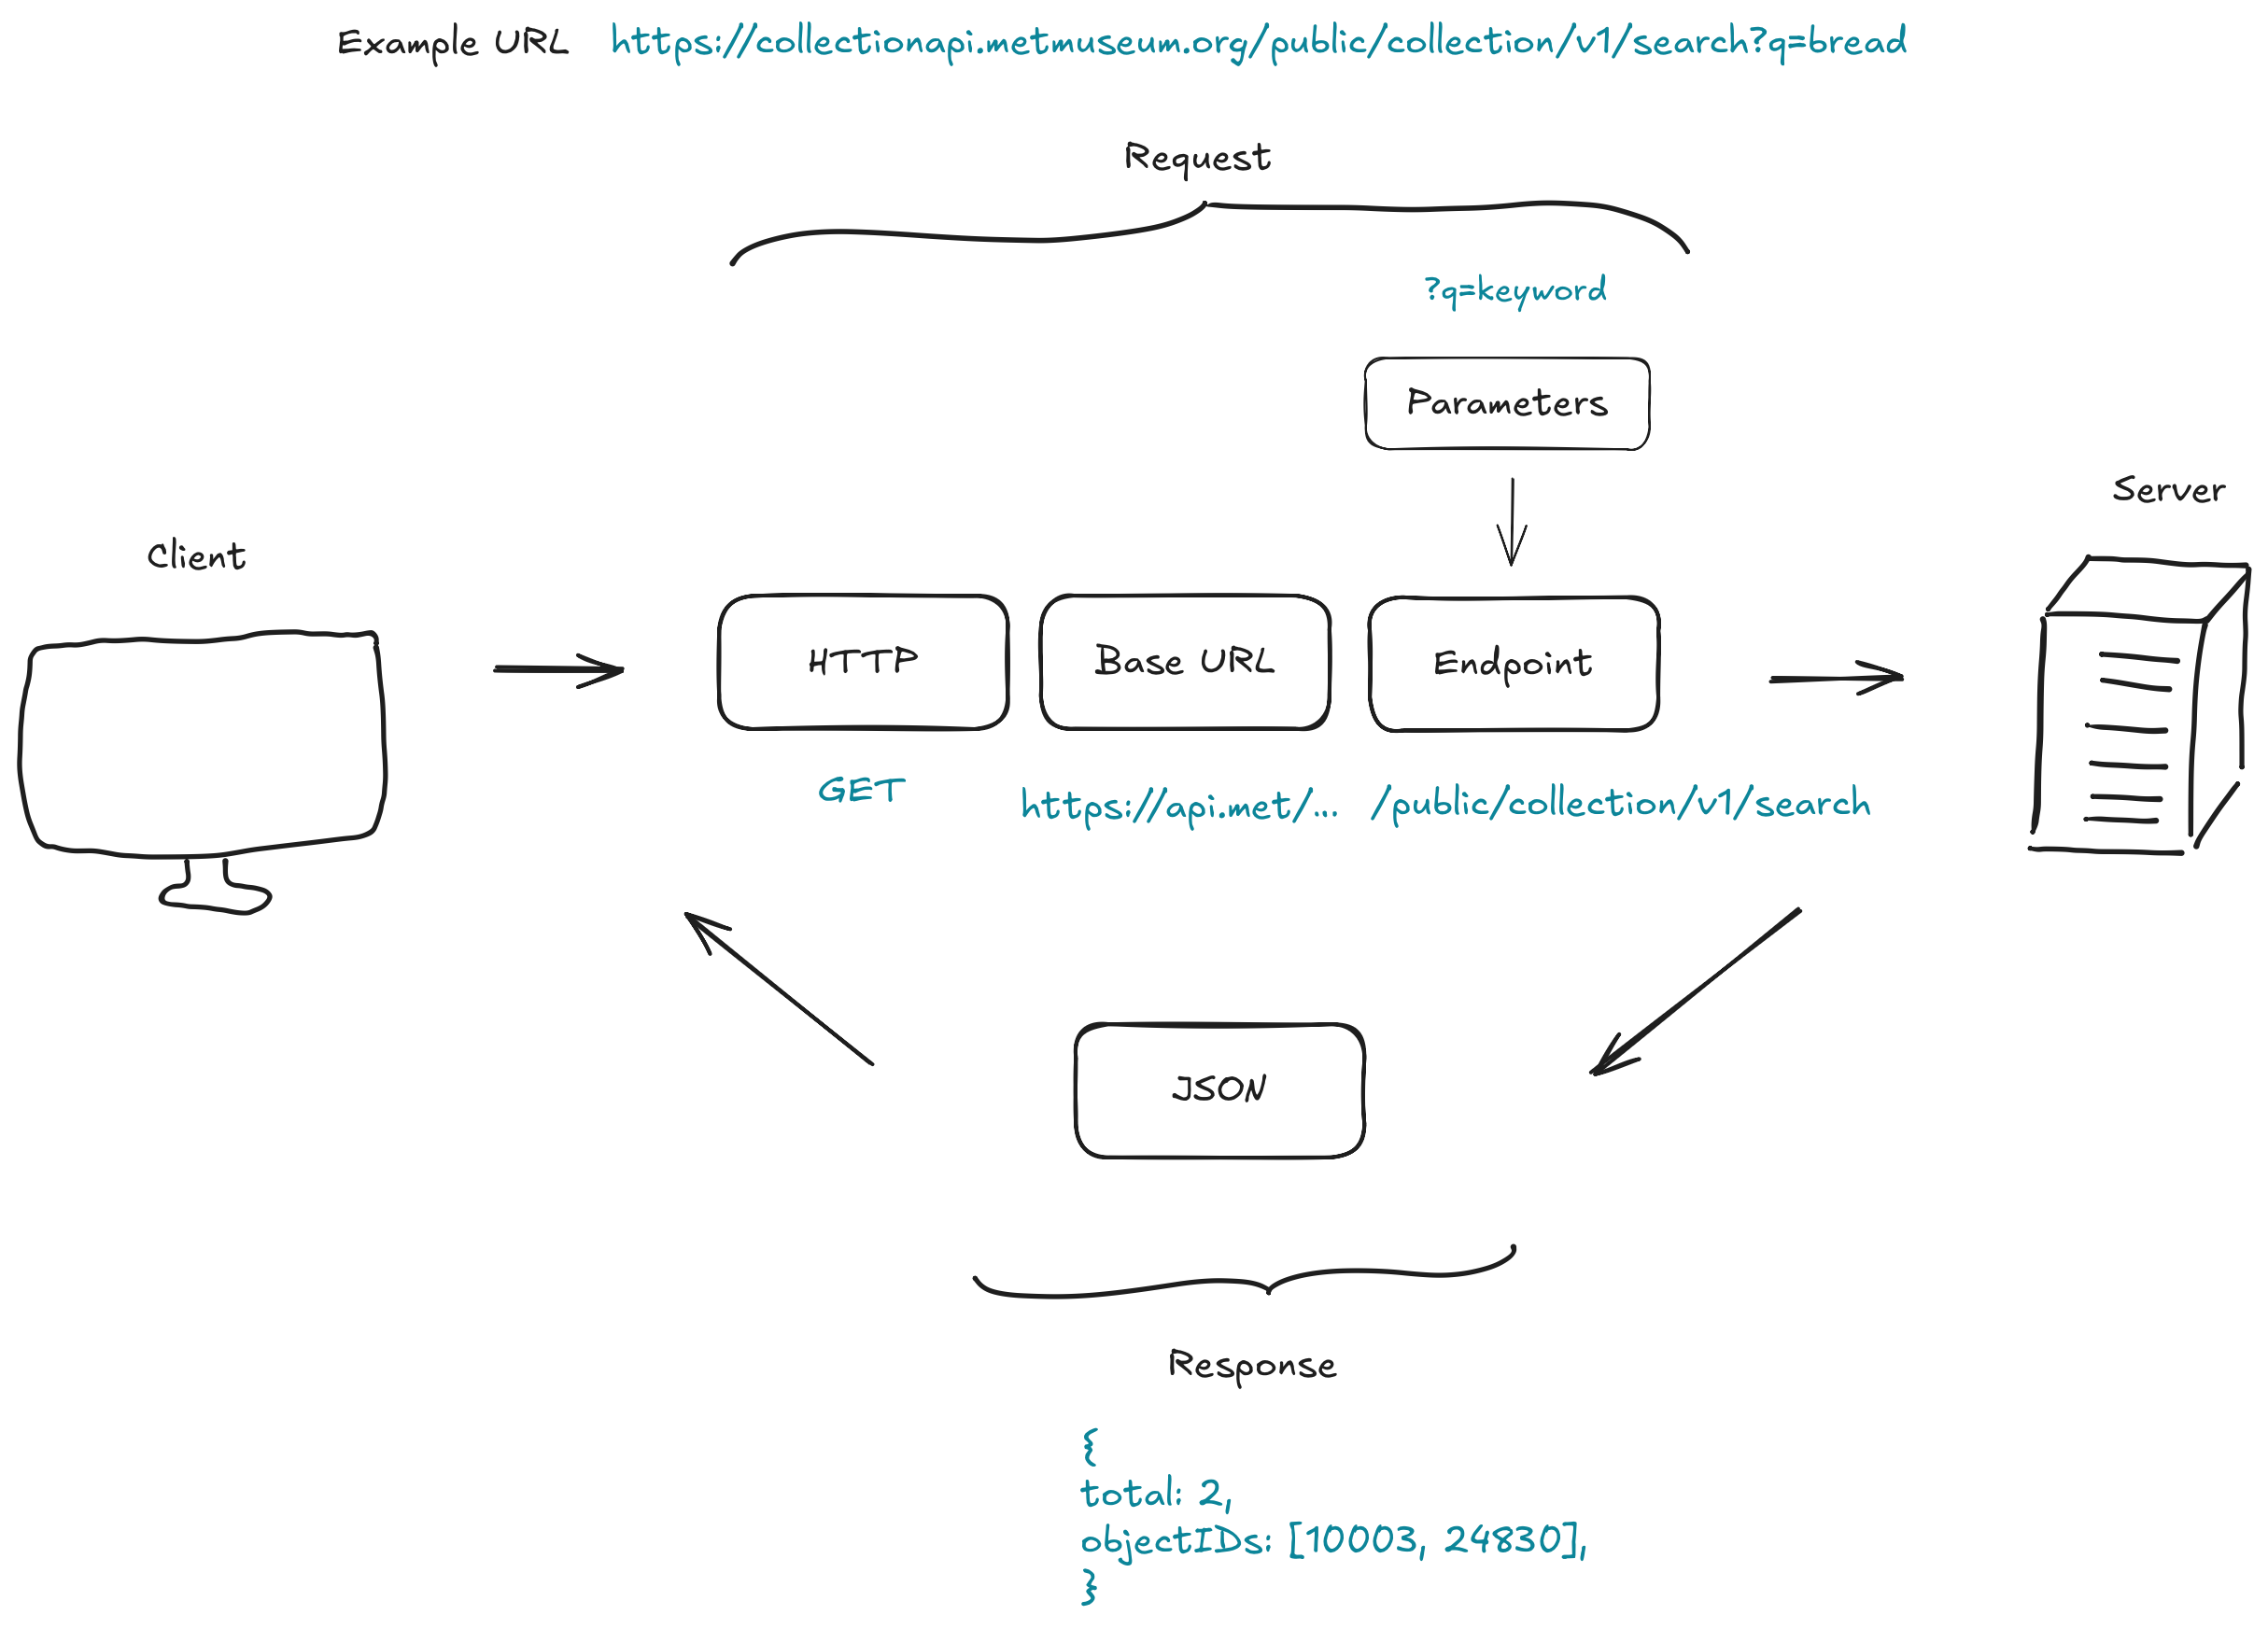
What will you know by the end of this lecture?

  • gain a better understanding of how APIs are used
  • build your own mini wrapper
  • learn to identify and understand the use of APIs in real-world contexts

Construct your own Economic Index

Naive Way

Import & Clean Data

library(readxl)
library(magrittr)
library(tidyr)

data <- read_xlsx("examples/je-d-04.02.01.03.xlsx") 

# subset only the rows 3 (= year) and 9 (= gdp)
gdp <- data[9,]
names(gdp) <- data[3,]

# pivot data longer (from excel wide format to data frame long format)
gdp_long <- gdp %>%
  pivot_longer(cols = everything(), names_to = "Year", values_to = "GDP")

# remove old headers (before pivot these used to be the first two columns)
gdp_long <- gdp_long[-c(1:2),]
# check structure
# str(gdp_long)

# convert to gdp num and year to int
gdp_long$GDP <- as.numeric(gdp_long$GDP)
gdp_long$Year <- as.integer(gdp_long$Year)

head(gdp_long, n=10)
# A tibble: 10 × 2
    Year     GDP
   <int>   <dbl>
 1  1995 423515.
 2  1996 426882.
 3  1997 433747.
 4  1998 444955.
 5  1999 453531.
 6  2000 476794.
 7  2001 489674.
 8  2002 489293.
 9  2003 493652.
10  2004 508608.

API (wrapper) way

API wrappers

Use the BFS API Wrapper for R

# devtools::install_github("lgnbhl/BFS")
library(BFS)

# to inspect functions, use ?function, e.g. 
?bfs_get_catalog_data

bfs_get_catalog_data(language = "en", title = "energy")
dataset_nr <- "px-x-0204000000_106"
energy_df <- bfs_get_data(dataset_nr, lang = "en")

# filter only total energy accounts
total_energy <- subset(
  energy_df,
  # filter for totals for each of the columns 
  `Economy and households` == "Economy and households - Total" &
  `Energy product` == "Energy product - Total",
  # select only the two relevant columns
  select = c(Year, `Energy accounts of economy and households`)
)

names(total_energy)[2] <- "Amount"

# View(total_energy)
head(total_energy, n=10)
# A tibble: 1 × 6
  title                 language number_bfs number_asset publication_date url_px
  <chr>                 <chr>    <chr>      <chr>        <date>           <chr> 
1 Energy accounts of e… en       px-x-0204… 36179320     2025-09-30       https…
# A tibble: 6 × 5
  `Unit of measure` `Economy and households`       `Energy product`       Year 
  <chr>             <chr>                          <chr>                  <chr>
1 Terajoules        Economy and households - Total Energy product - Total 2000 
2 Terajoules        Economy and households - Total Energy product - Total 2001 
3 Terajoules        Economy and households - Total Energy product - Total 2002 
4 Terajoules        Economy and households - Total Energy product - Total 2003 
5 Terajoules        Economy and households - Total Energy product - Total 2004 
6 Terajoules        Economy and households - Total Energy product - Total 2005 
# ℹ 1 more variable: `Energy accounts of economy and households` <dbl>
# A tibble: 10 × 2
   Year    Amount
   <chr>    <dbl>
 1 2000  1103603.
 2 2001  1127768.
 3 2002  1112879.
 4 2003  1130842.
 5 2004  1131767.
 6 2005  1121999.
 7 2006  1157170.
 8 2007  1126804.
 9 2008  1158734.
10 2009  1136915.

BFS API - under the hood

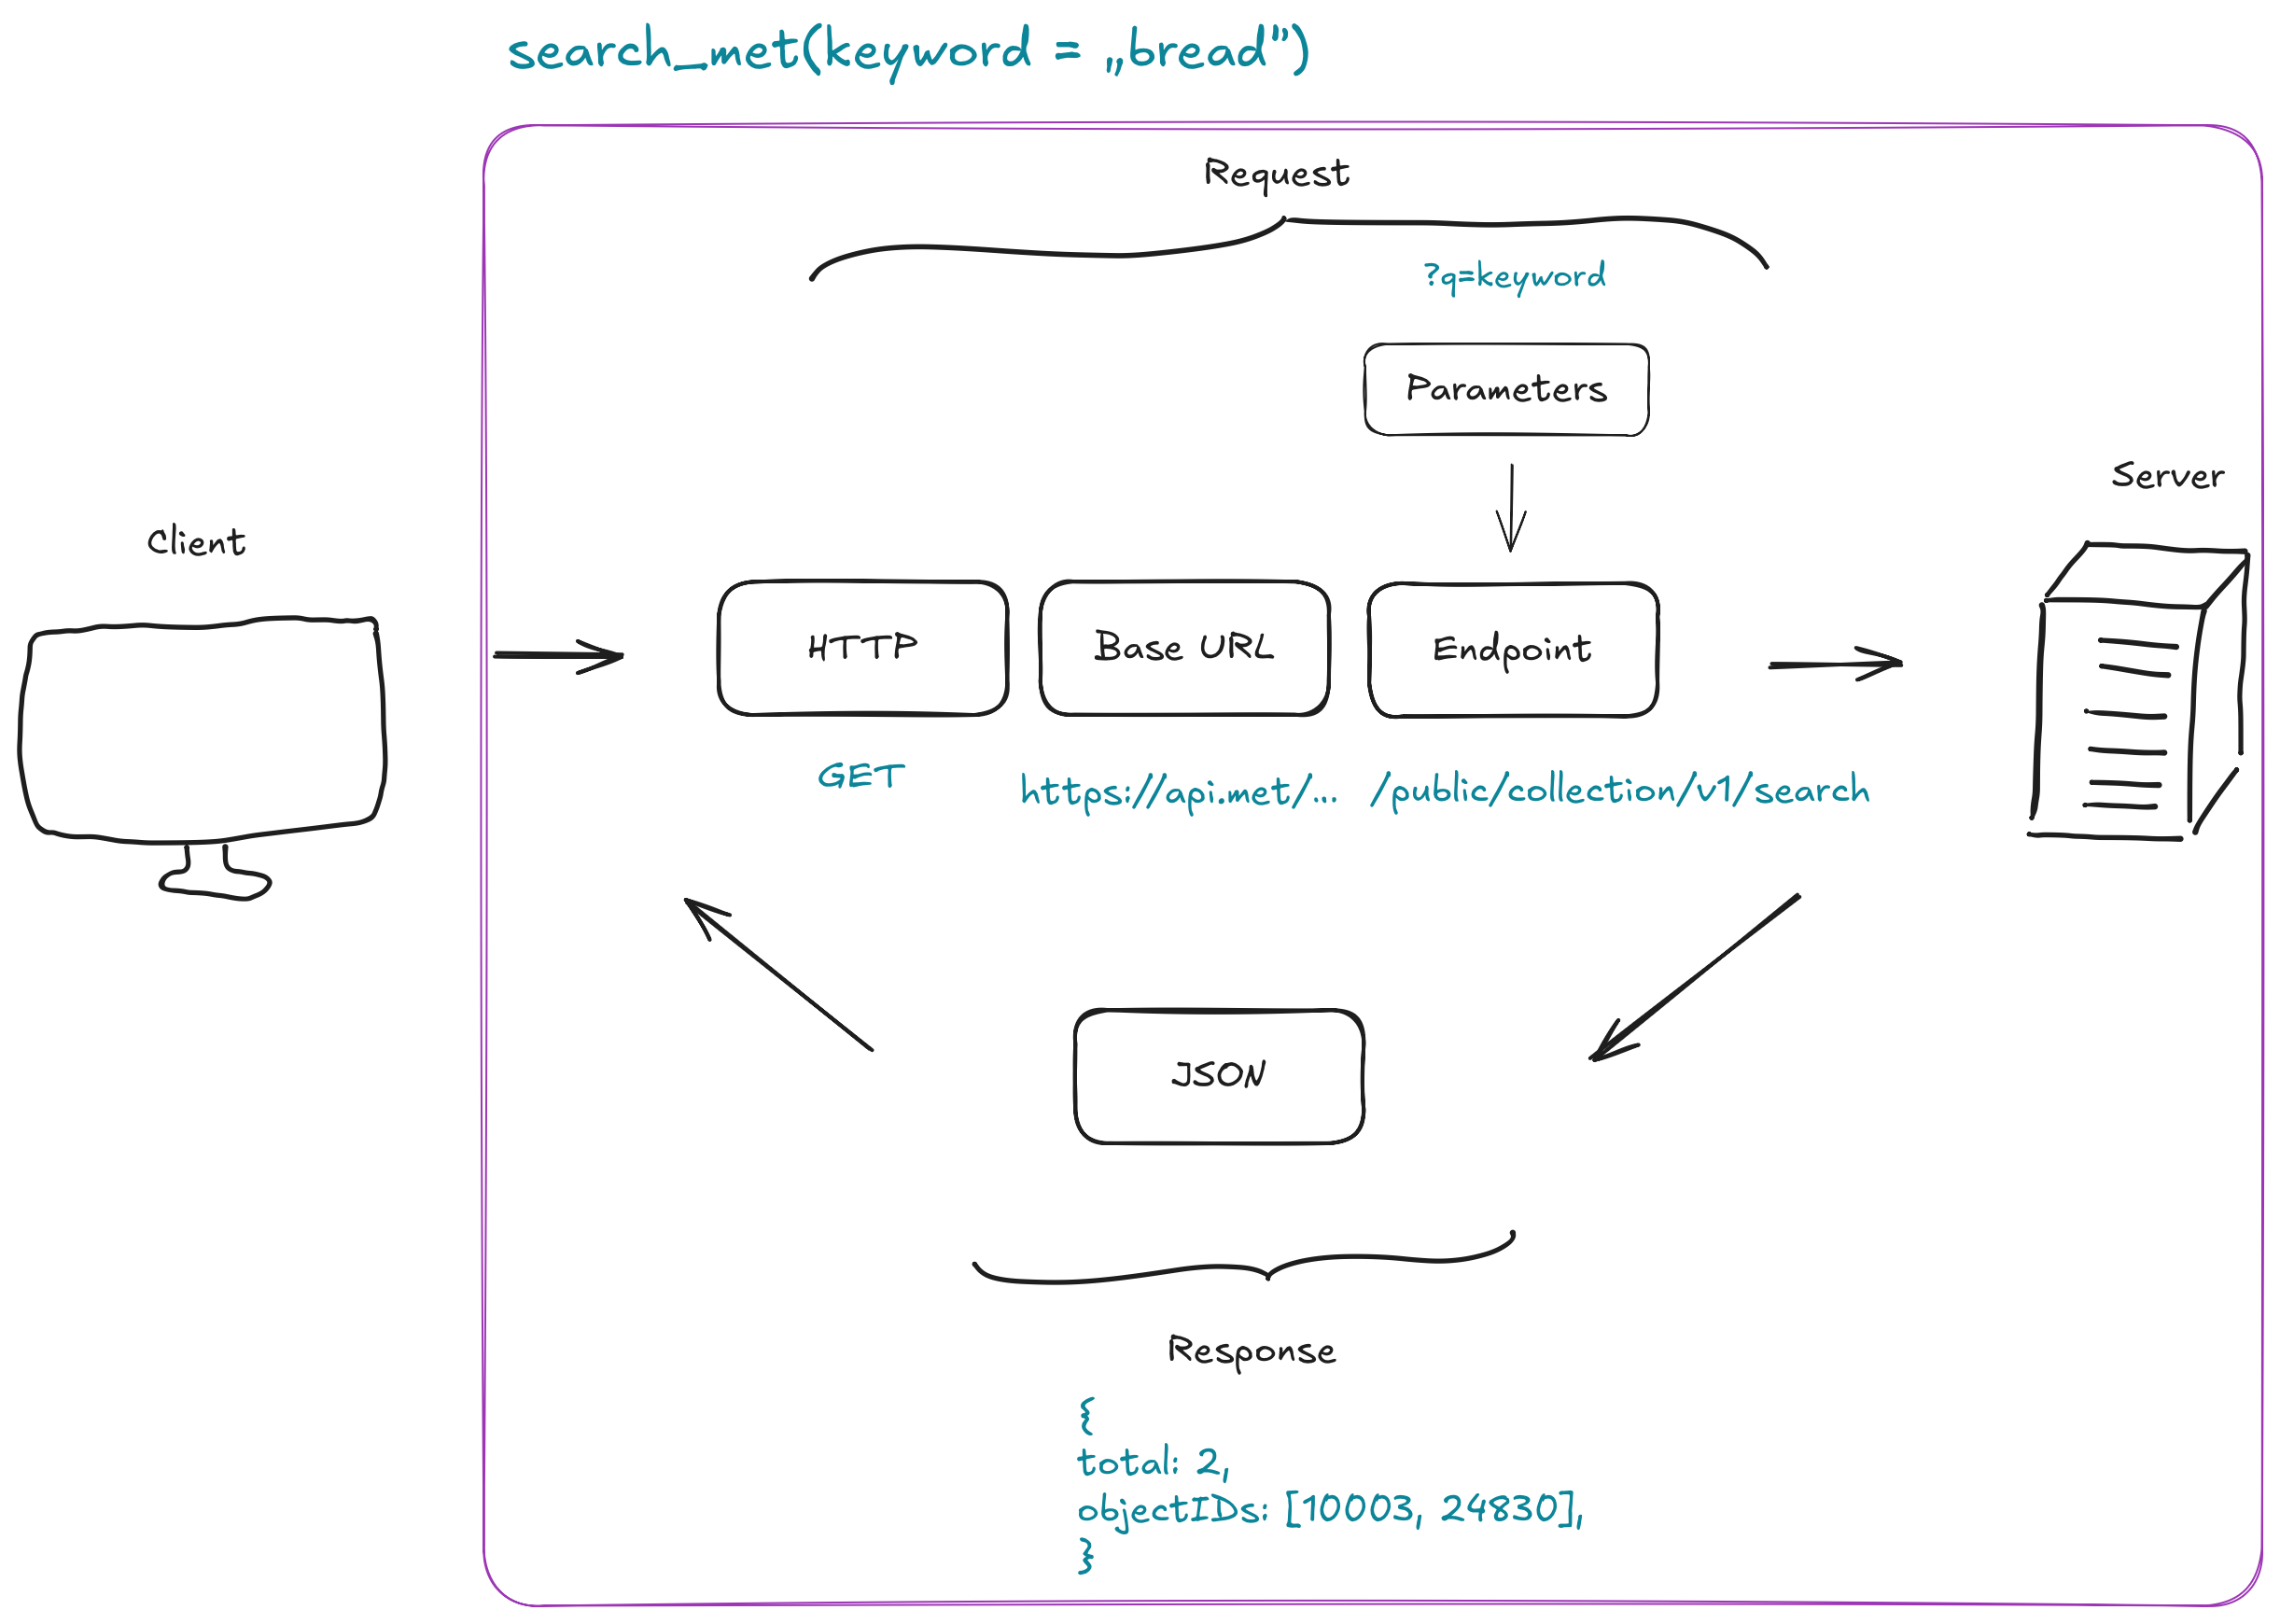
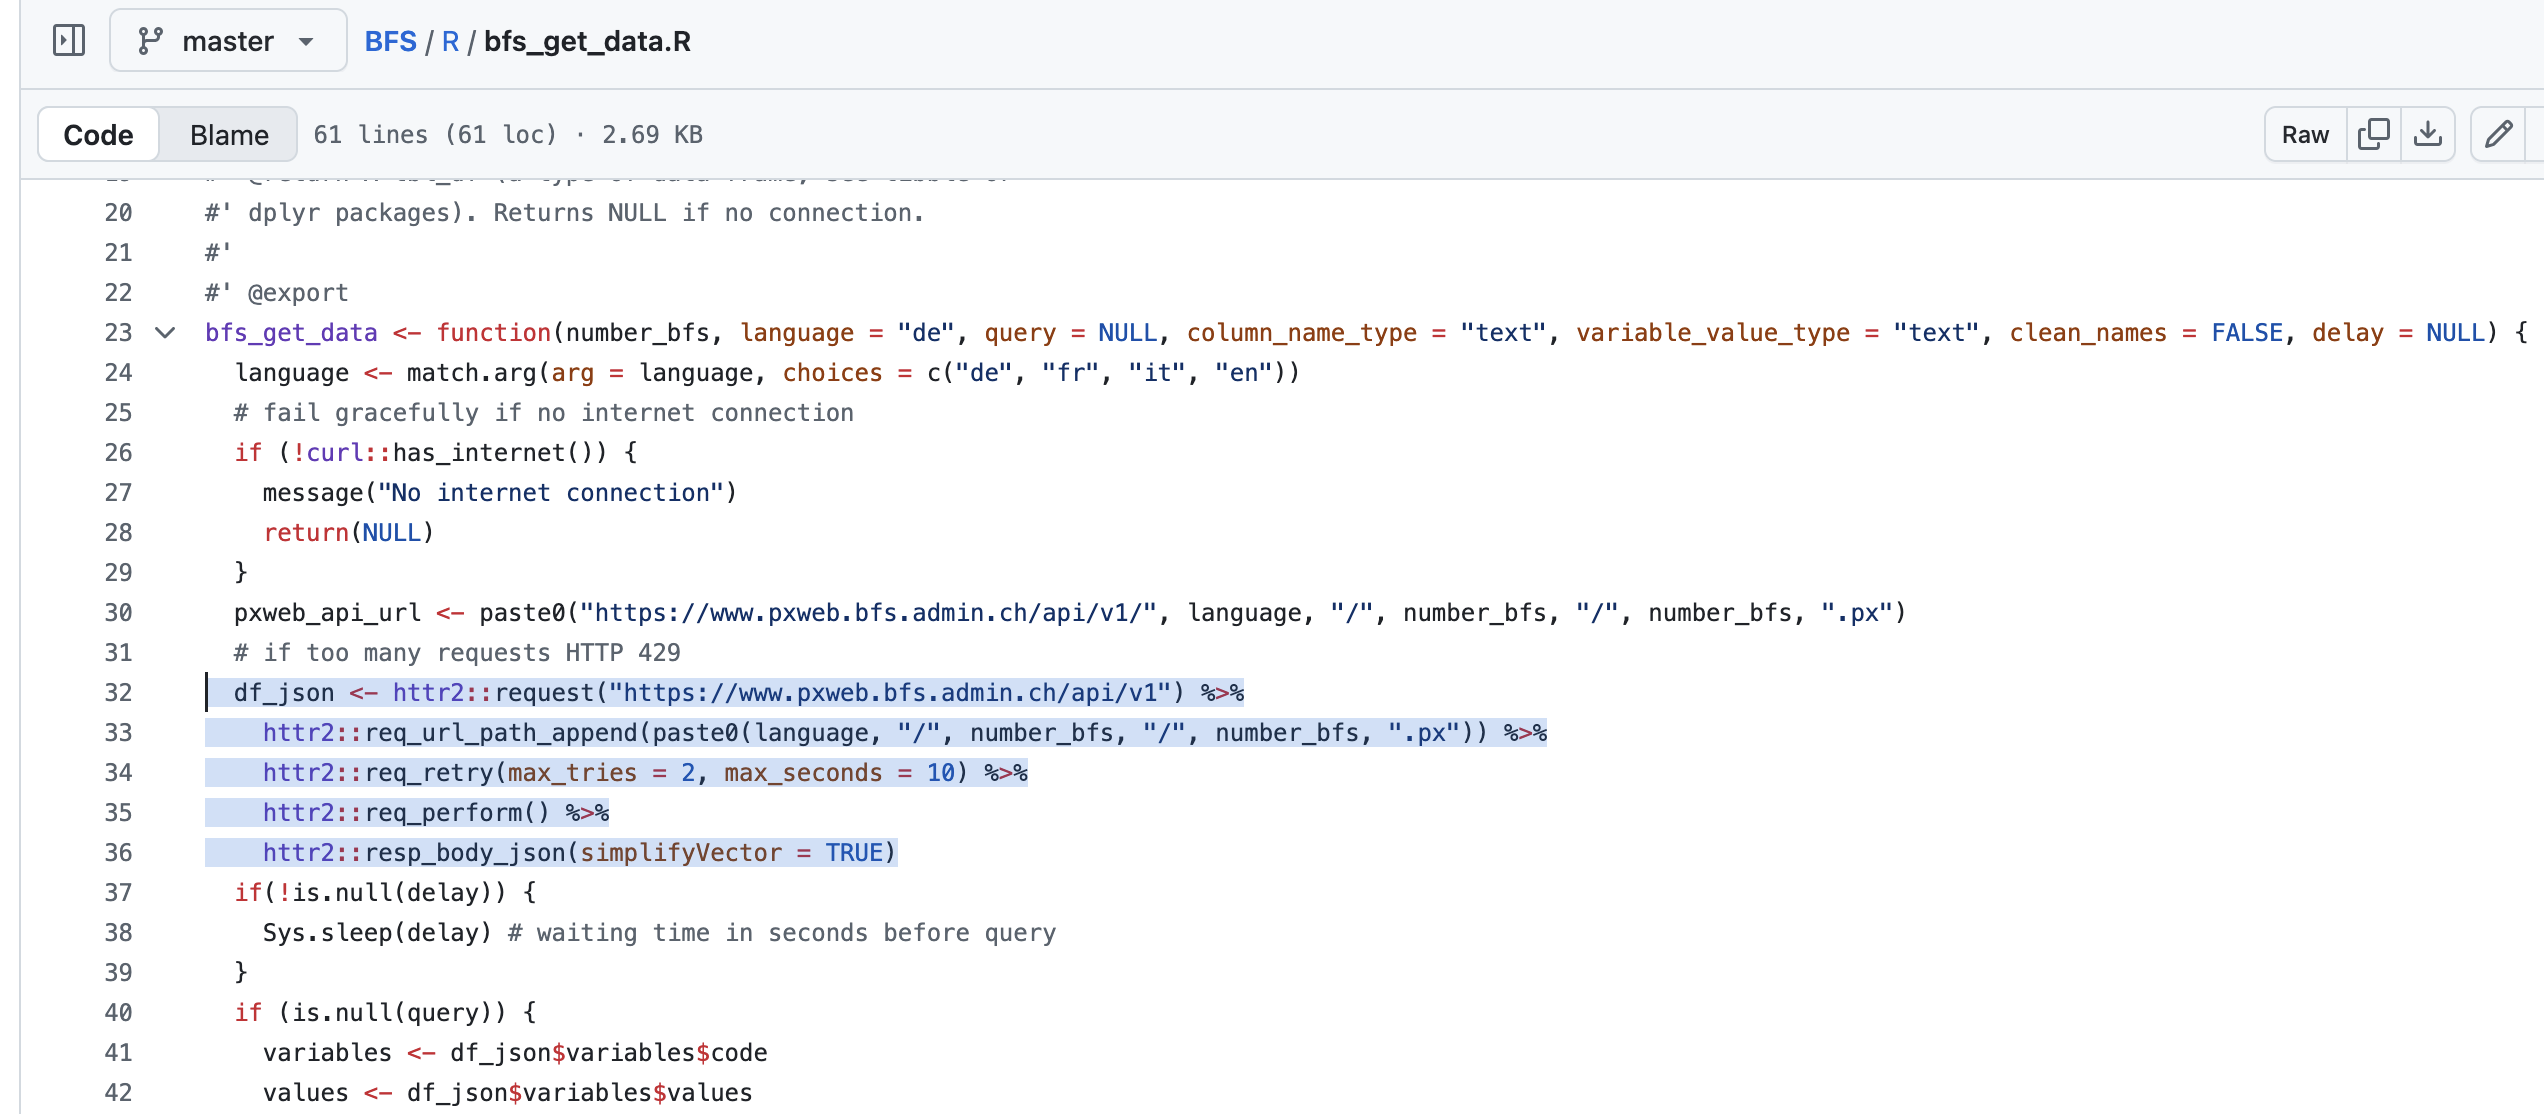
Let’s take a closer look

bfs_get_data <- function(number_bfs, language = "de", query = NULL, column_name_type = "text", variable_value_type = "text", clean_names = FALSE, delay = NULL) {
  # base url
  df_json <- httr2::request("https://www.pxweb.bfs.admin.ch/api/v1") %>%
    # add endpoints
    httr2::req_url_path_append(paste0(language, "/", number_bfs, "/", number_bfs, ".px")) %>%
    httr2::req_retry(max_tries = 2, max_seconds = 10) %>%
    # executre request
    httr2::req_perform() %>%
    # transform response to json
    httr2::resp_body_json(simplifyVector = TRUE)

Why APIs?

  • automation
  • easier to fetch specific data (specify time, specific indicators)
  • real time data
  • API usage (often) so much easier than scraping & downloading & reading & cleaning!! (all-in-1)
  • used everywhere!

Exercises: Build your own API wrapper

httr2 cheatsheet

Category Function Description
Request request() Creates a new HTTP request object that defines the endpoint and method (e.g., GET, POST).
Request req_perform() Sends the built request to the server and returns the response object.
Response resp_body_json() Parses the response body as JSON and returns it as an R list.
Response resp_status() Retrieves the HTTP status from the response object.

COVID 19 API

  • building our Economic Index
  • for the time during and post covid
  • for this, get vaccination and COVID 19 case rates (incl. death & recovery)

GET COVID Case Counts

library(httr2)
# library(magrittr)
get_case_counts <- function(country = "CH", period = "all"){
  base_url <- "https://disease.sh/v3/covid-19/historical"
  final_url <- paste0(base_url, "/", country, "?lastdays=", period)

  # alternative - using magrittr pipe
  # req <- request(base_url) %>%
  #   req_url_path_append(country) %>%
  #   req_url_query(period = period)

  # perform API call with httr2
  req <- request(final_url) 
  resp <- req_perform(req)

  # if request is not successful
  if (resp_status(resp) != 200){
    message("The request was not successful")
  }
  else{
    return(resp_body_json(resp))
  }
}

get_case_counts("CH", 5)
$country
[1] "Switzerland"

$province
$province[[1]]
[1] "mainland"


$timeline
$timeline$cases
$timeline$cases$`3/5/23`
[1] 4412439

$timeline$cases$`3/6/23`
[1] 4412439

$timeline$cases$`3/7/23`
[1] 4413911

$timeline$cases$`3/8/23`
[1] 4413911

$timeline$cases$`3/9/23`
[1] 4413911


$timeline$deaths
$timeline$deaths$`3/5/23`
[1] 14207

$timeline$deaths$`3/6/23`
[1] 14207

$timeline$deaths$`3/7/23`
[1] 14207

$timeline$deaths$`3/8/23`
[1] 14209

$timeline$deaths$`3/9/23`
[1] 14210


$timeline$recovered
$timeline$recovered$`3/5/23`
[1] 0

$timeline$recovered$`3/6/23`
[1] 0

$timeline$recovered$`3/7/23`
[1] 0

$timeline$recovered$`3/8/23`
[1] 0

$timeline$recovered$`3/9/23`
[1] 0

Exercise Description

  • use the API documentation: https://disease.sh/docs/
  • use the template to write a function to get vaccination rates for a country
library(httr2)

get_country_vaccine_rates <- function(country = "CH", period = "all"){

  base_url <- "..."
  final_url <- "..."

  # perform  API call with httr2
  req <- "..."(final_url) 
  resp <- "..."(req)

  # if request is not successful
  if (resp_status(resp) != 200){
    message("The request was not successful")
  }
  else{
    return(resp_body_json(resp))
  }
}

Sample Solution

GET Vaccine Rates

library(httr2)

get_country_vaccine_rates <- function(country = "CH", period =  "all"){
  # https://disease.sh/v3/covid-19/vaccine/coverage/countries/CH?lastdays=30&fullData=false
  base_url <- "https://disease.sh/v3/covid-19/vaccine/coverage/countries"
  final_url <- paste0(base_url, "/", country, "?lastdays=", period, "&fullData=false")

  # perform  API call with httr2
  req <- request(final_url) 
  resp <- req_perform(req)

  # if request is not successful
  if (resp_status(resp) != 200){
    message("The request was not successful")
  }
  else{
    return(resp_body_json(resp))
  }
}

get_country_vaccine_rates("CH", 5)
$country
[1] "Switzerland"

$timeline
$timeline$`7/17/25`
[1] 16940716

$timeline$`7/18/25`
[1] 16940716

$timeline$`7/19/25`
[1] 16940716

$timeline$`7/20/25`
[1] 16940716

$timeline$`7/21/25`
[1] 16940716

Other examples of APIs & API wrappers for economic data

  • the kofdata R Package (for KOF data)
  • the BFS R package (for Swiss federal statistics)
  • the fredapi Python Library (for US economic data)
  • the fredr data from the Federal Reserve Economic Data (FRED) API R package
  • public-apis a Github repository listing Public APIs

Thank you for your attention!

If you are interested in working with us or if you have any questions: